Blynk Board Project Guide
 jimblom
 Project 10: Charting Lighting History
Blynk's History Graph widget takes the standard graph to the next level. It allows you to compare a widget's value to data from hours, days, weeks, even months back.
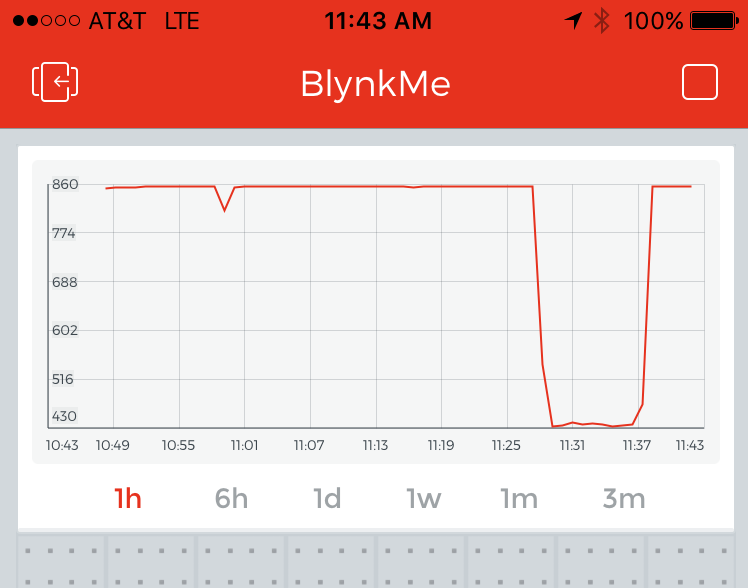
In this project, we'll plug readings from a light sensor into the History Graph. After you've let the project run for a while, you'll be able to track the sun rise/set time, or find out if someone's been snooping in a room when they're not supposed to be.
Hardware Setup
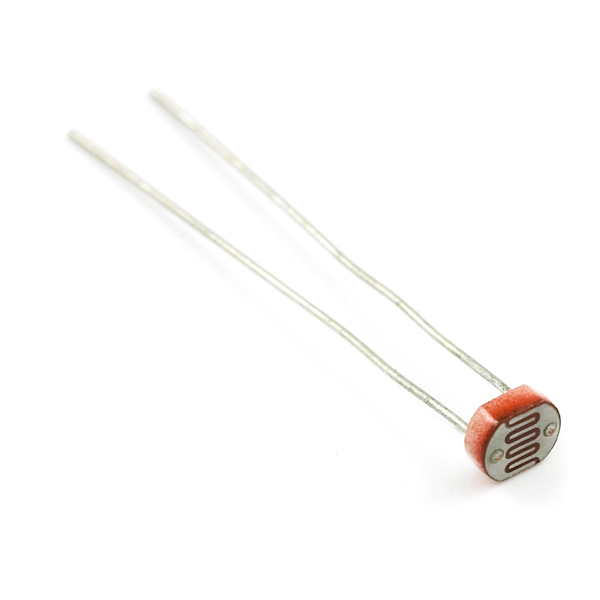
To measure ambient light, we're going to use a light-sensitive resistor called a photocell. When it's pitch-black, the photocell morphs into a large, 10kΩ resistor, but when light shines on the cell, the device's resistance drops closer to 1kΩ.
To create a voltage for the Blynk Board's ADC using the photocell's variable resistance, we need to pair it with a second resistor. The photocell and resistor will combine to create a variable voltage divider.
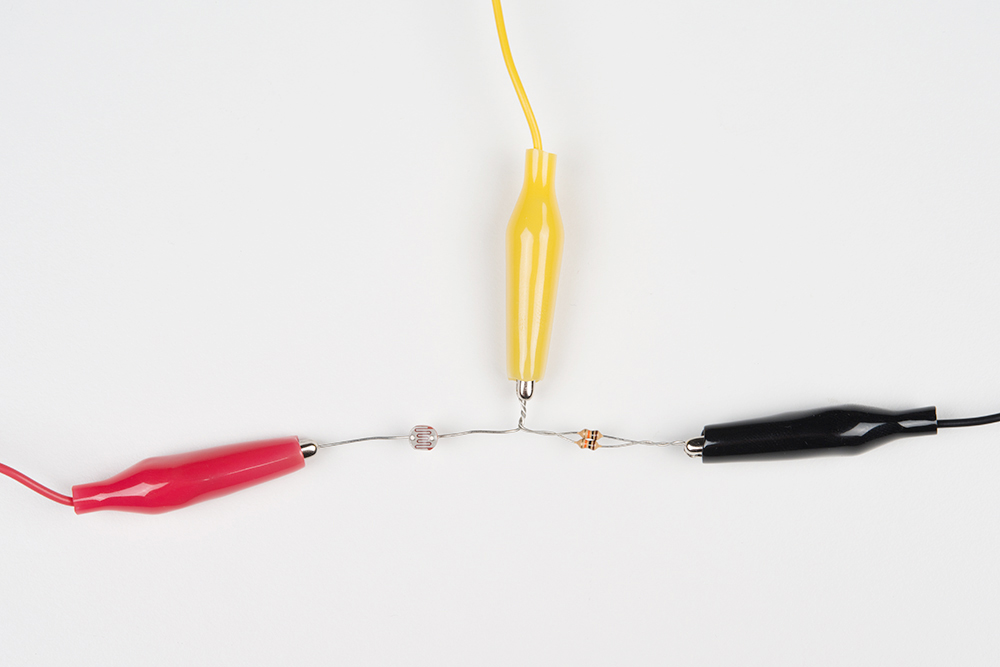
That second resistor should be somewhere in the middle of the photocell's resistance range -- right about 5kΩ. There aren't any 5kΩ resistors in the IoT Starter Kit, but it does include the means to create one! By combining two equal resistors in parallel, we can cut their total resistance in half.
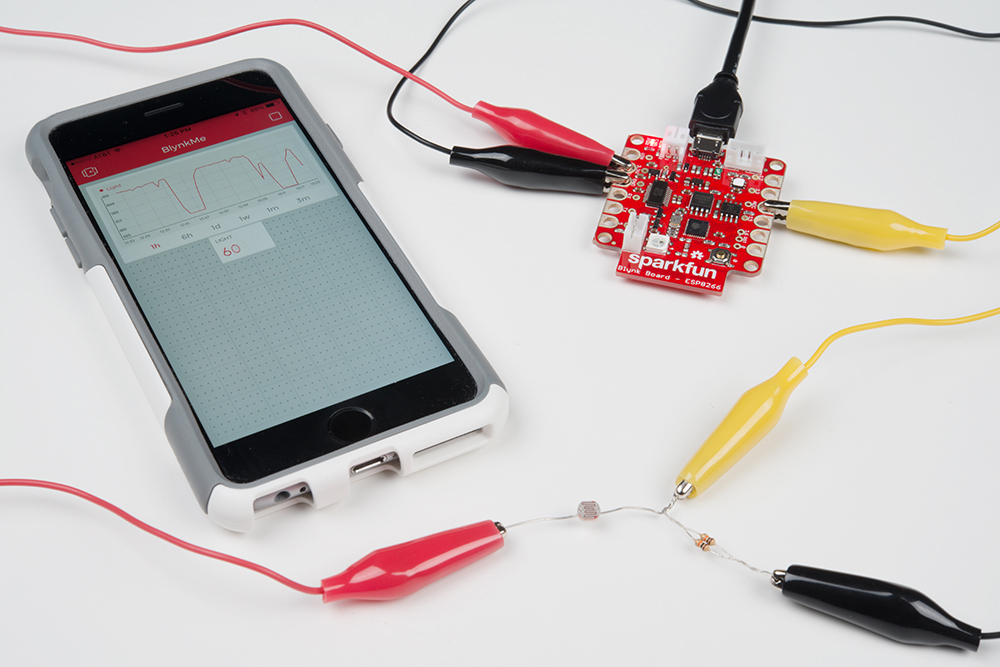
To create a 5kΩ resistor, grab two 10kΩ resistors, and twist them together in parallel -- that is, twist the ends of both resistors together, so the bodies are touching each other. Then, twist one leg of the photocell together with one shared leg of our new 5kΩ resistor.

Clip a yellow alligator cable to the middle legs -- the behemoth that is two resistors and a photocell leg twisted together. Then clip a red cable onto the photocell's leg and a black cable onto the other resistor leg.
On the Blynk Board -- as you're probably used to by now -- clip the yellow to ADC, red to 3.3V, and black to GND.
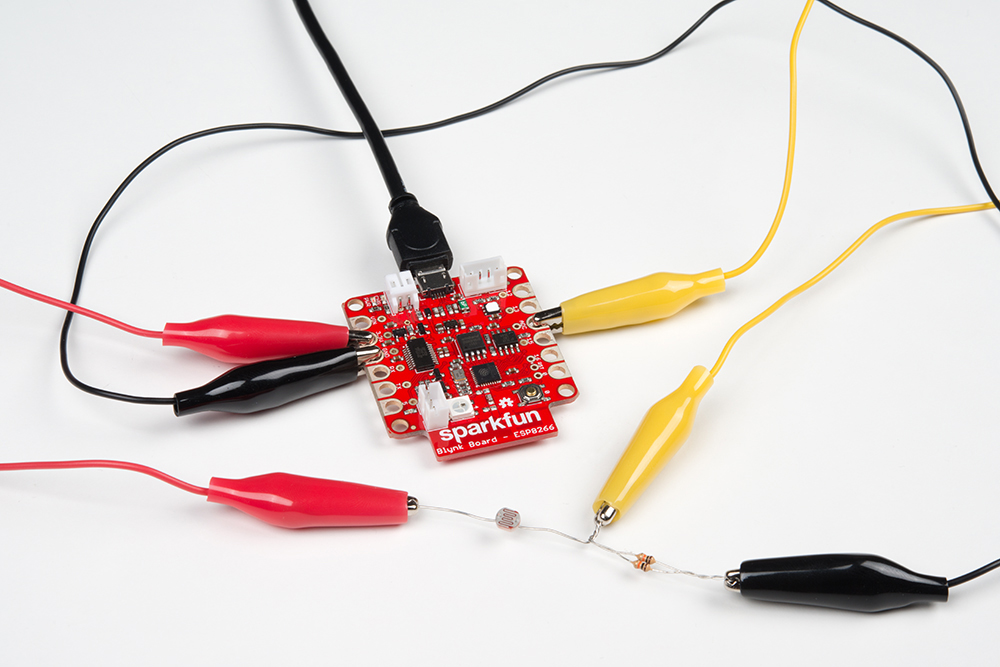
This circuit will produce a higher voltage in the light and a lower voltage in the dark.
Blynk Setup
This Blynk project combines the History Graph widget with a Value widget to display the real-time light reading.
Configure a Value Widget
Before adding the graph, add a Value widget and configure it to read from V18.

Set the update rate to 1 second, and name the widget "Light."
Add a History Graph Widget
Once the Value widget is in place, add a History Graph widget. In the settings, configure any one of the four PIN's to V18.
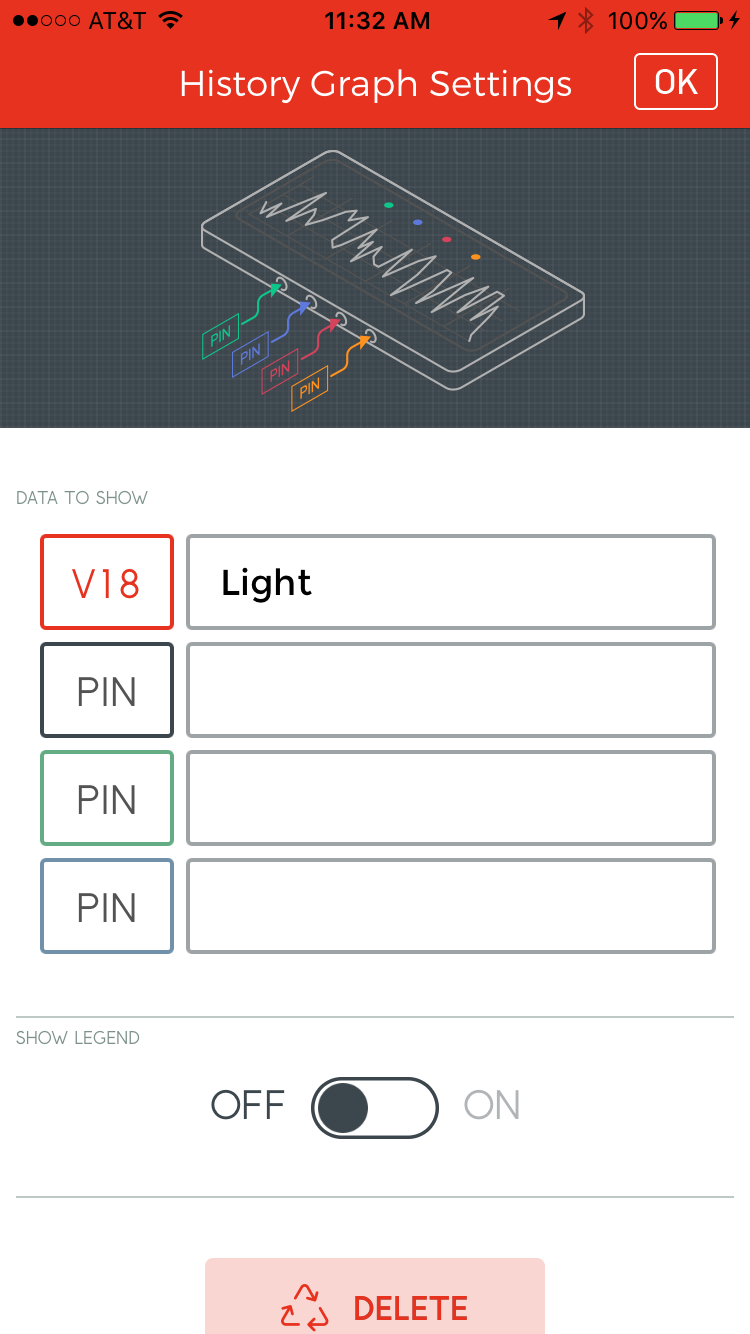
The textbox adjacent to the pin should automatically update to "Light" (or whatever the Value widget is configured as).
There is one quirk with the History Graph widget -- it won't directly pull or request a variable's value. It relies on widgets like Value or Gauge to get the latest value from a virtual or physical pin.
Blynk Run
After running the project, begin by monitoring the Value widget's reading -- it should vary between 0 and 1023. See how high you can get the value reading by shining a light on it. (Hint: your phone might just have a bright LED to shine on the photocell.)
Then cover up the photocell, or turn off your lights, and see how low you can get the reading. Or, add a zeRGBa, turn the brightness up to max, and have the Blynk Board feed back into its own light sensor.
To really get the most out of the history widget, you need to leave the project running for at least an hour. If it's about time to hang it up for the night, leave your Blynk project plugged in and graphing. Maybe you'll catch someone sneaking in and turning the light on!
If you ever want to delete old history from the History Graph, swipe left on the graph (while the project is running), and select "Erase data."
Going Further
You can add up to four values to the History Graph -- play around with the other three pins to see what other interesting info you can graph.
You may have to remove some of the previous pins to adjust the graph's scale.
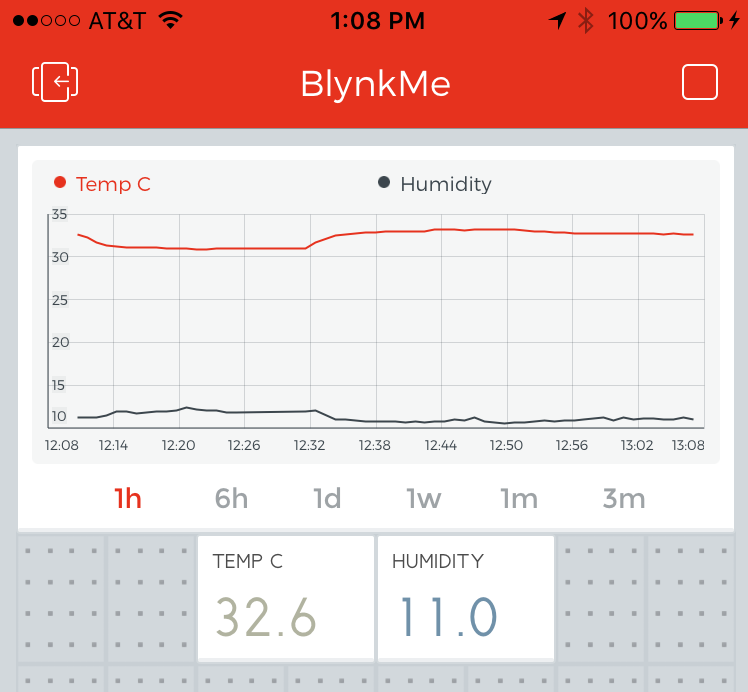
Celsius temperature and humidity -- usually around the same order of magnitude -- pair nicely on the graph together. Use the legend so you don't forget which is which!