Experiment Guide for the Johnny-Five Inventor's Kit
Experiment 3: Reading a Potentiometer
Introduction
So far the experiments have been focused on output: writing code with Johnny-Five to control the state of one or more LEDs. In this experiment, you'll learn how to read analog input data from a potentiometer. You'll learn about how development boards (like the Tessel 2) sample and process analog input and how to use data from analog sources to make things happen. Using data from the potentiometer, you'll control a bar graph in your terminal, alter the brightness of an LED and control the activity of multiple LEDs.
Preflight Check
Whoa there, Turbo! If this is your first experiment with the Johnny-Five Inventor's Kit (J5IK) and the Tessel 2, there are a few things you gotta do first:Suggested Reading
The following tutorials provide in-depth background on some of the hardware concepts in this experiment:
- What is a Circuit? -- This tutorial will explain what a circuit is, as well as discuss voltage in further detail.
- Analog to Digital Conversion
- Analog vs. Digital
- Voltage, Current, Resistance, and Ohm's Law -- Learn the basics of electronics with these fundamental concepts.
- LEDs (Light-Emitting Diodes) -- LEDs are found everywhere. Learn more about LEDs and why they are used in so many products all over the world.
- Resistors -- Why use resistors? Learn more about resistors and why they are important in circuits like this one.
- Polarity -- Polarity is a very important characteristic to pay attention to when building circuits.
Parts Needed
You will need the following parts for this experiment:
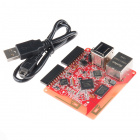
- 1x Tessel 2
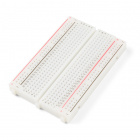
- 1x Breadboard
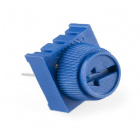
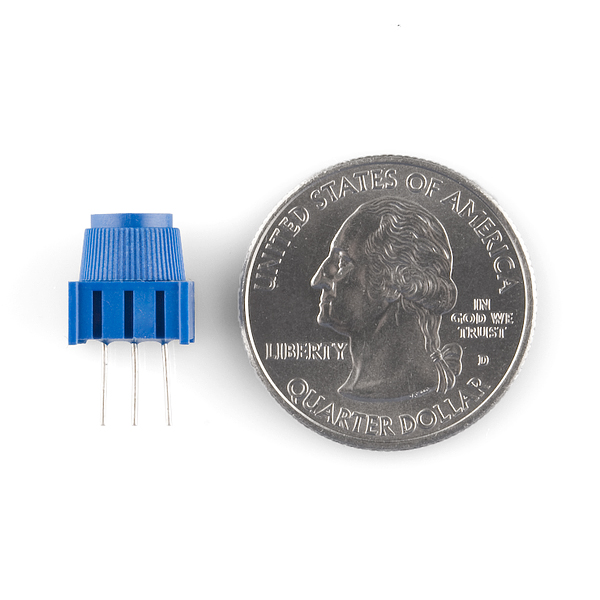
- 1x Potentiometer
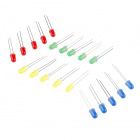
- 1x Standard LED (any color)
- 1x 100Ω Resistor
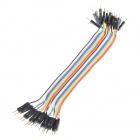
- 7x Jumper Wires
Tessel 2
DEV-13841Introducing Potentiometers
A potentiometer is a resistance-based analog sensor that changes its internal resistance based on the rotation of its knob. The potentiometer has an internal voltage divider, creating a varying voltage on the center pin. The voltage on the center pin changes as the knob is turned. You can use an analog input pin to read this changing voltage.
Hardware Hookup
Its now the fun part! It's time to start building your circuit. Let's take a look at what goes into building this circuit.
| Polarized Components | Pay special attention to the component’s markings indicating how to place it on the breadboard. Polarized components can only be connected to a circuit in one direction. |
Build the Potentiometer Circuit
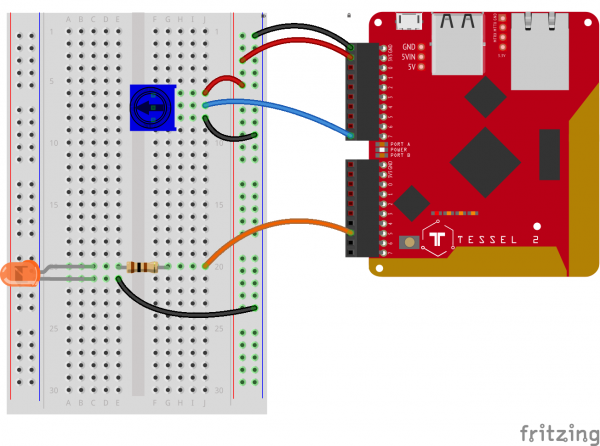
To hook up the potentiometer, attach the two outside pins to a supply voltage (3.3V in this circuit) and ground. It doesn’t matter which is connected where, as long as one is connected to power, and the other to ground. The center pin is then connected to an analog input pin so the Tessel 2 can measure changes in voltage as the knob is turned.
- Connect the potentiometer to the breadboard. Connect the potentiometer's power pins (supply and ground) to the power rail with jumper wires and connect the middle pin to the Tessel 2's Port A, Pin 7.
- Connect the LED. Use a jumper wire to connect the Tessel 2's Port B, Pin 5 through the 100Ω resistor and to the LED's anode (positive, longer) leg. Connect the LED's cathode to ground on the power rail. Double-check the legs on the LED to make sure you haven't plugged it in backward!
- Use jumper wires to connect the Tessel 2's 3.3V and GND pins to the breadboard's power rails.
Reading Analog Sensors With Johnny-Five
Open your favorite code editor, create a file called sensor-basic.js and save it in the j5ik/ directory. Type — or copy and paste — the following JavaScript code into your sensor-basic.js file:
language:javascript
var five = require("johnny-five");
var Tessel = require("tessel-io");
var board = new five.Board({
  io: new Tessel()
});

board.on("ready", () => {
  var sensor = new five.Sensor("a7");

  sensor.on("change", () => console.log(sensor.value));
});
To Deploy Code Over WiFi:
- Connect your Tessel to the same Wifi network as your computer t2 wifi -n[SSID] -p[PASSWORD]`
- Make sure that your Tessel is provisioned and shows up in your list of Tessels using t2 list. See the Hardware Installation and Setup for how to provision your Tessel if it doesn't show up in your list.
- Deploy your code using the
--lantag. Example: t2 run mycode.js --lan
Type — or copy and paste — the following into your terminal:
t2 run sensor-basic.js
This isn't particularly interesting, as all it does is output the value of the sensor (integers between 0 and 1023) until the program is interrupted. yawn
Exploring the Hardware
Analog Input
For software to be able to work with data coming from an analog sensor, it first needs to be converted from an analog signal (infinite possible values) to a digital signal (discrete set of values). The microcontroller on the Tessel 2 does this analog-to-digital conversion (ADC) for you, sampling the incoming analog voltages and converting them to a range of values between 0 (0V) and 1023 (3.3V). Values in between are quantized to the nearest integer.
Asynchronous I/O
In Experiment 1: Blink an LED, we looked at the asynchronous nature of Node.js runtime, comparing how the Arduino Programming Language's delay function is blocking, while Johnny-Five's execution model follows the Node.js convention: non-blocking. Listening for Board ready events is an example of a common asynchronous pattern. Non-blocking I/O is extremely important to the JavaScript-for-hardware story, and the Tessel 2 has an exemplary implementation.
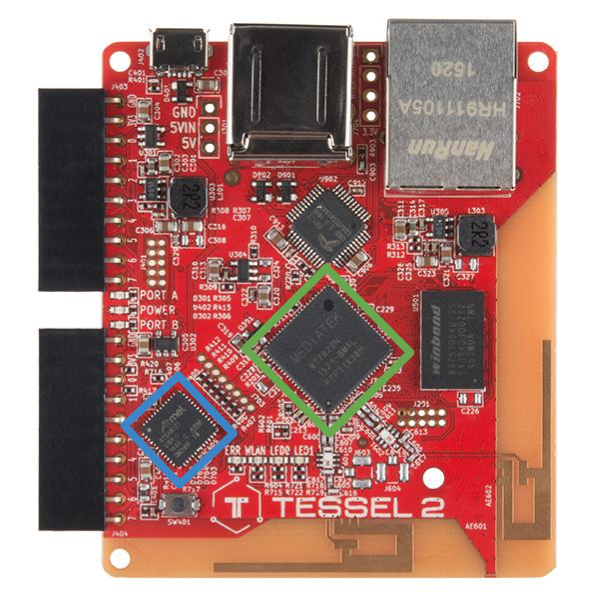
Tessel 2's support for asynchronous, non-blocking I/O is in its hardware. In addition to the Mediatek chip (that's where your code executes), it has a second processor (Atmel® SAMD21) that is responsible for I/O.
The MediaTek processor and the Atmel coprocessor exchange messages representing I/O state. Code that executes on the MediaTek chip (the Linux user space) has asynchronous access to the state captured on SAMD21. For example, if a digital input pin goes HIGH, the SAMD21 sends a message to the MediaTek chip and any code running can elect to consume that message. When code running on the MediaTek chip wants to output values to the SAMD21 to be written to an output pin, it simply sends the message, then keeps going.
For the purpose of our experiment, it's helpful to understand that when program code running on the MediaTek chip wants to know the value of an analog input, it sends a request for that information, registers a handler (a function) and continues on. Sometime "later" (likely within a millisecond or two), and always in a different execution turn, the SAMD21 responds with the present value of the input. The registered handler is then invoked with response value. This may happen once or repeatedly, but never causes the program to stop and wait.
Exploring the Code
Once the board has emitted the ready event, hardware inputs are ready for interaction:
language:javascript
var sensor = new five.Sensor("a7");
The first thing to do is create an instance of the Sensor class, indicating that this sensor is attached to Port A, Pin 7.
language:javascript
sensor.on("change", () => console.log(sensor.value));
Then, a handler function is registered for change events, meaning that anytime the reading changes, the function will be called.
Every time this function is called and the sensor value is displayed, it occurs in a different execution turn than the previous invocation, staying true to the asynchronous, non-blocking model. The handler function for change events simply logs sensor.value. sensor.value is a 10-bit number (0-1023), representing the last successful ADC-processed read from the Sensor object's associated analog input pin.
Note: The minimum version of Node.js that runs on Tessel 2 supports many ES2015 features, including Arrow Functions, so we're using those here to simplify the program.
Variation: Sensor Input Graphing
For this experiment, you will be "bar chart graphing" light intensity values in your terminal using the Barcli module:

barcli [bahrk-lee]
Barcli is a simple tool for displaying real-time data in the console. Multiple instances of Barcli can be stacked to show multiple axes, sensors or other data sources in an easy-to-read horizontal bar graph.
In your terminal, make sure you're inside the working directory (j5ik), then type — or copy and paste — the following command:
npm install barcli
We'll make our sensor data a little more interesting (than just numbers scrolling by). Let's visualize it as a graph displayed directly in the terminal. Open your favorite code editor, create a file called sensor-graph.js and save it in the j5ik/ directory.
Type — or copy and paste — the following JavaScript code into your sensor-graph.js file:
language:javascript
var Barcli = require("barcli");
var five = require("johnny-five");
var Tessel = require("tessel-io");
var board = new five.Board({
  io: new Tessel(),
  repl: false,
  debug: false,
});

board.on("ready", function() {
  var range = [0, 100];
  var graph = new Barcli({
    label: "My Data",
    range: range,
  });
  var sensor = new five.Sensor({
    pin: "a7",
    threshold: 5 // See notes below for detailed explanation
  });

  sensor.on("change", () => {
    graph.update(sensor.scaleTo(range));
  });
});
To Deploy Code Over Wifi:
- connect your Tessel to the same Wifi network as your computer t2 wifi -n[SSID] -p[PASSWORD]`
- Make sure that your Tessel is provisioned and shows up in your list of Tessels using t2 list, see Hardware Installation and Setup for how to provision your Tessel if it doesn't show up in your list.
- Deploy your code using the
--lantag. Example: t2 run mycode.js --lan
Type — or copy and paste — the following into your terminal:
t2 run sensor-graph.js
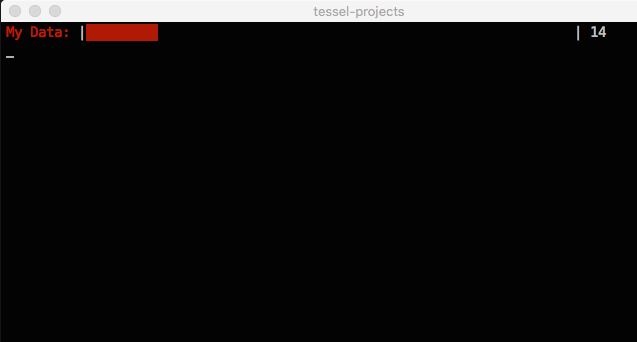
Once the program starts up, the terminal should display something like this:
Exploring the Code
Notice that the Board constructor call is being passed an object with two properties that we haven't seen before: repl: false and debug: false. These settings tell Johnny-Five to shut off both the "on-by-default" REPL (read–eval–print loop—an interactive prompt) and connection debugging output.
Also added is a the Barcli module:
language:javascript
var Barcli = require("barcli");
... which means it can be put to use in your program.
To create a graph, we'll need an instance of a Barcli object. First, though, we need to define a range of values that are valid for the graph:
language:javascript
var range = [0, 100];
var graph = new Barcli({
  label: "My Data",
  range: range,
});
The graph object is now able to represent values from 0 to 100. However, recall that values coming from the potentiometer will range from 0 to 1023. We've got to scale those, too, so that they can be graphed!
The way we're instantiating the Sensor object looks a bit different from the previous example. Instead of passing the constructor a String identifying the pin, like so:
language:javascript
var sensor = new five.Sensor("a7");
... we're using the options object form here, which allows us to pass a whole object full of extra information to the constructor:
language:javascript
var sensor = new five.Sensor({
  pin: "a7",
  threshold: 5
});
Let's talk about that threshold property. It defines how much a sensor's value needs to change before a change event is emitted. The default value of threshold is 1. As you saw in the first example, any change to the sensor's value -- remember, values range from 0 to 1023 and are whole numbers (integers) -- will cause a change event. For this variation, that's too much sensitivity.
Specifically, we want to define a threshold that will limit the change events to those that are relevant to our range, which is 0-100. Since we'll be scaling the sensor's value from 0-1023 to 0-100, we only care about changes of approximately every 10 steps in 1023 (obviously that's fudging a little, and you're encouraged to be more precise in your actual programs). The threshold value is exactly half of the approximate step:
> (value + 5)< (value - 5)
Finally, the program replaces the call to console.log(...) with a call to graph.update(...) and passes the result of calling the sensor object's scaleTo(...) method with the same range as graph is using:
language:javascript
sensor.on("change", () => {
  graph.update(sensor.scaleTo(range));
});
Unpacking the line:
language:javascript
graph.update(sensor.scaleTo(range));
When invocations are nested like this, they proceed from the inside out. First, the sensor object's 10-bit value is scaled to 0-100 (range) and then that resulting value is passed to the graph object's update method.
Variation: Using Sensor Input to Create Output
For the final variation of this experiment, you'll process the sensor readings to control the brightness of the LED in your circuit. Open your favorite code editor, create a file called sensor-input-to-output.js and save it in the j5ik/ directory. Type — or copy and paste — the following JavaScript code into your sensor-input-to-output.js file:
language:javascript
var five = require("johnny-five");
var Tessel = require("tessel-io");
var board = new five.Board({
  io: new Tessel()
});

board.on("ready", function() {
  var sensor = new five.Sensor({
    pin: "a7",
    threshold: 2
  });
  var led = new five.Led("b5");

  sensor.on("change", () => {
    led.brightness(sensor.scaleTo(0, 255));
  });
});
Type — or copy and paste — the following into your terminal:
t2 run sensor-input-to-output.js
Once the program starts up, LED should display something like this:
Exploring the Code
Again, we're instantiating a Sensor object to represent the potentiometer, and defining a threshold. This time we'll set it to 2, because the rounded result of 1023 (the top of the 10-bit sensor range) divided by 255 (the top of the 8-bit brightness range) is 4, and threshold should be set to half of the full step size:
language:javascript
var sensor = new five.Sensor({
  pin: "a7",
  threshold: 2
});
Next, a new instance of the Led class is created, with Pin 5 on Port B:
language:javascript
var led = new five.Led("b5");
+The change event remains the same, but the operation within the handler is updated to call the led object's brightness(...) method, passing the sensor's value scaled from its 10-bit input range (0-1023) to the 8-bit output range (0-255) of the led:
 language:javascript
 sensor.on("change", () => {
   led.brightness(sensor.scaleTo(0, 255));
 });
Alternatively, the conversion could have been written as a bit-shifting operation, where the 10-bit value is shifted 2 bits to the right, since brightness(...) expects an 8-bit value (0-255). This bit-shifting operation is the most efficient way to scale the 10-bit analog input value to the 8-bit PWM output value:
language:javascript
0b1111111111 === 1023;
0b0011111111 === 255;
0b11111111 === 255;
(0b1111111111 >> 2) === 255;
And could be applied in our code like so:
language:javascript
sensor.on("change", () => {
  led.brightness(sensor.value >> 2);
});
This snippet means "shift the sensor.value 2 bits to the right" — the two right-most bits are discarded. Voila! An 8-bit number from a 10-bit number.
Building Further
- Experiment with bit shifting in your Node.js console.
Reading Further
- JavaScript -- JavaScript is the programming language that you'll be using:
- Node.js -- Node.js is the JavaScript runtime where your programs will be executed.
- Johnny-Five -- Johnny-Five is a framework written in JavaScript for programming hardware interaction on devices that run Node.js.
