Smart Home Expansion Kit for Arduino 101
 D___Run___
 Experiment 8: Atmospheric Conditions with BME280
Introduction
The sensor used in this experiment is pretty sophisticated. The BME280 reads barometric pressure, temperature and humidity. It can even extrapolate altitude based on pressure changes! It communicates all that data to the Arduino 101 using a serial protocol called I2C (Inter-Integrated Circuit). This sensor has library support for Arduino and works out of the box. In this experiment we will be building an environmental monitoring system with the BME280 and displaying the data in Blynk. With this device you will be able to carry around and monitor the atmospheric conditions in real time. This is great for figuring out heating and cooling issues, checking your altitude, or even just checking the temperature around you if you decide to make it portable in a backpack...or dare I say fanny pack?
Suggested Reading
The following tutorial provides in-depth background on some of the hardware concepts in this experiment:
Parts Needed
You will need the following parts for this experiment:
- 1x Arduino 101 Board (From your Arduino 101 SIK)
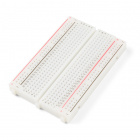
- 1x Breadboard (From your Arduino 101 SIK)
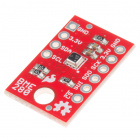
- 1x The BME280 Atmospheric Sensor
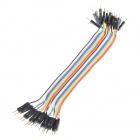
- 6x Jumper Wires (From your Arduino 101 SIK)
Didn't Get the Around-the-Home Expansion Kit?
If you are conducting this experiment and didn't get the Around-the-Home Expansion Kit, we suggest using these parts:
Headers or No Headers?
Note:If you are buying the breakout boards (BME280 Breakout) seperate from this kit you will also need to buy female breakaway pins and assemble (solder) the pins to your board yourself.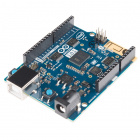
Arduino 101
DEV-13787Introduction to the BME280

The SparkFun BME280 Atmospheric Sensor Breakout is an easy way to measure aspects of the atmosphere around you, including pressure, humidity and air temperature. All of this is combined into a petite package called a breakout board.
The 3.3V breakout is power-efficient, using as little as 5µA (that's 1/1,000,000 of an amp!) when idling and less than 1mA when taking measurements. There are 10 pins on the breakout board, but six is the maximum ever used at one time.
In this experiment you will work with the BME280 to read the temperature, pressure and humidity of the room as well as your altitude based off of the atmospheric pressure and print it out on the LCD screen. Finally, in the Touch of Blynk section you will use your BME280 to send atmospheric data to your Blynk app.
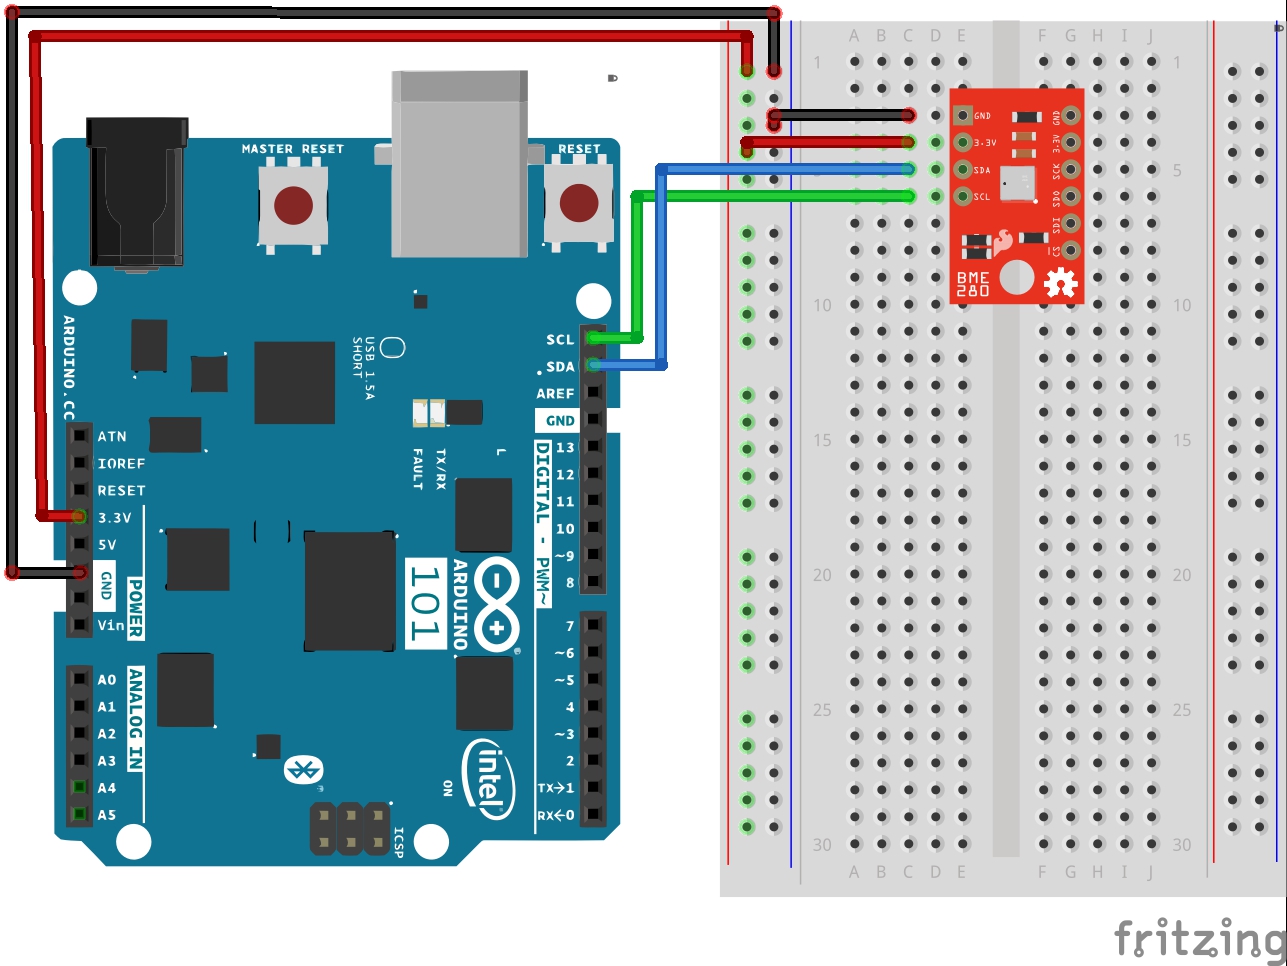
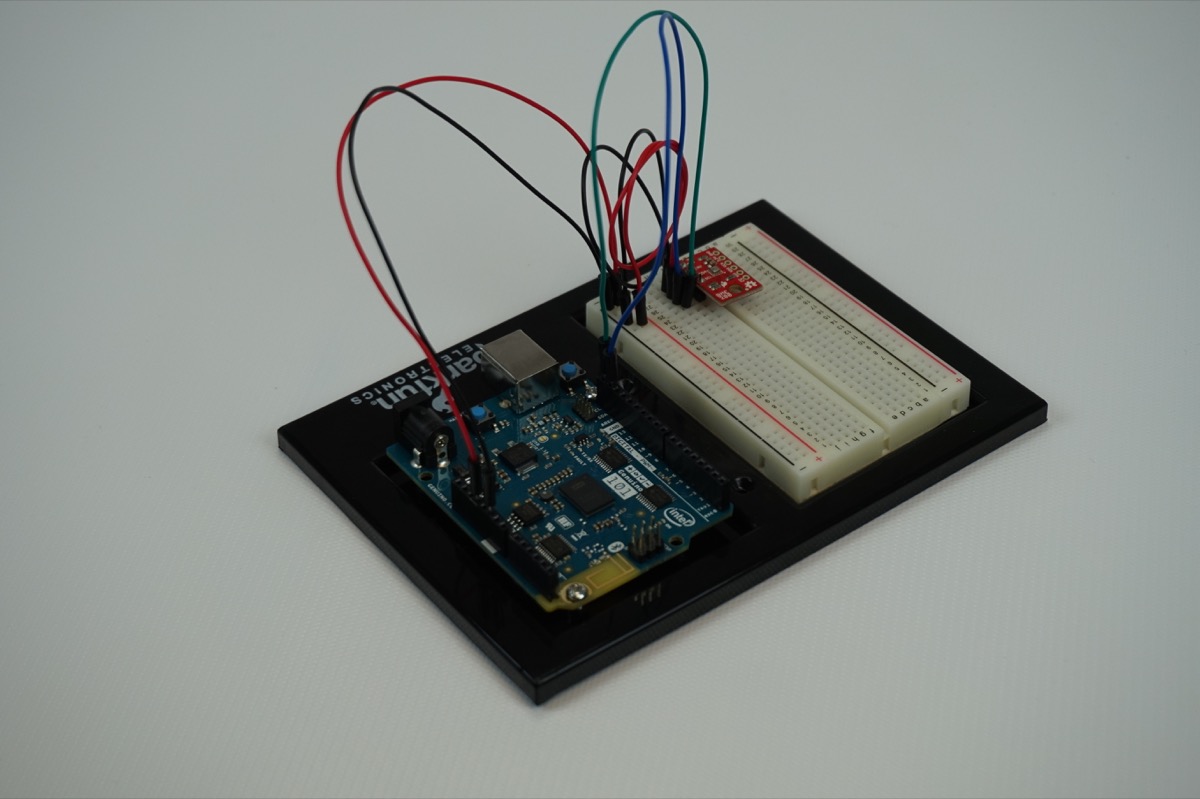
Hardware Hookup
Is it hot in here, or is it just me? Let's find out using this sensor, but first you need to hook it up!
Wiring Diagram for the Experiment
Build Your Blynk App
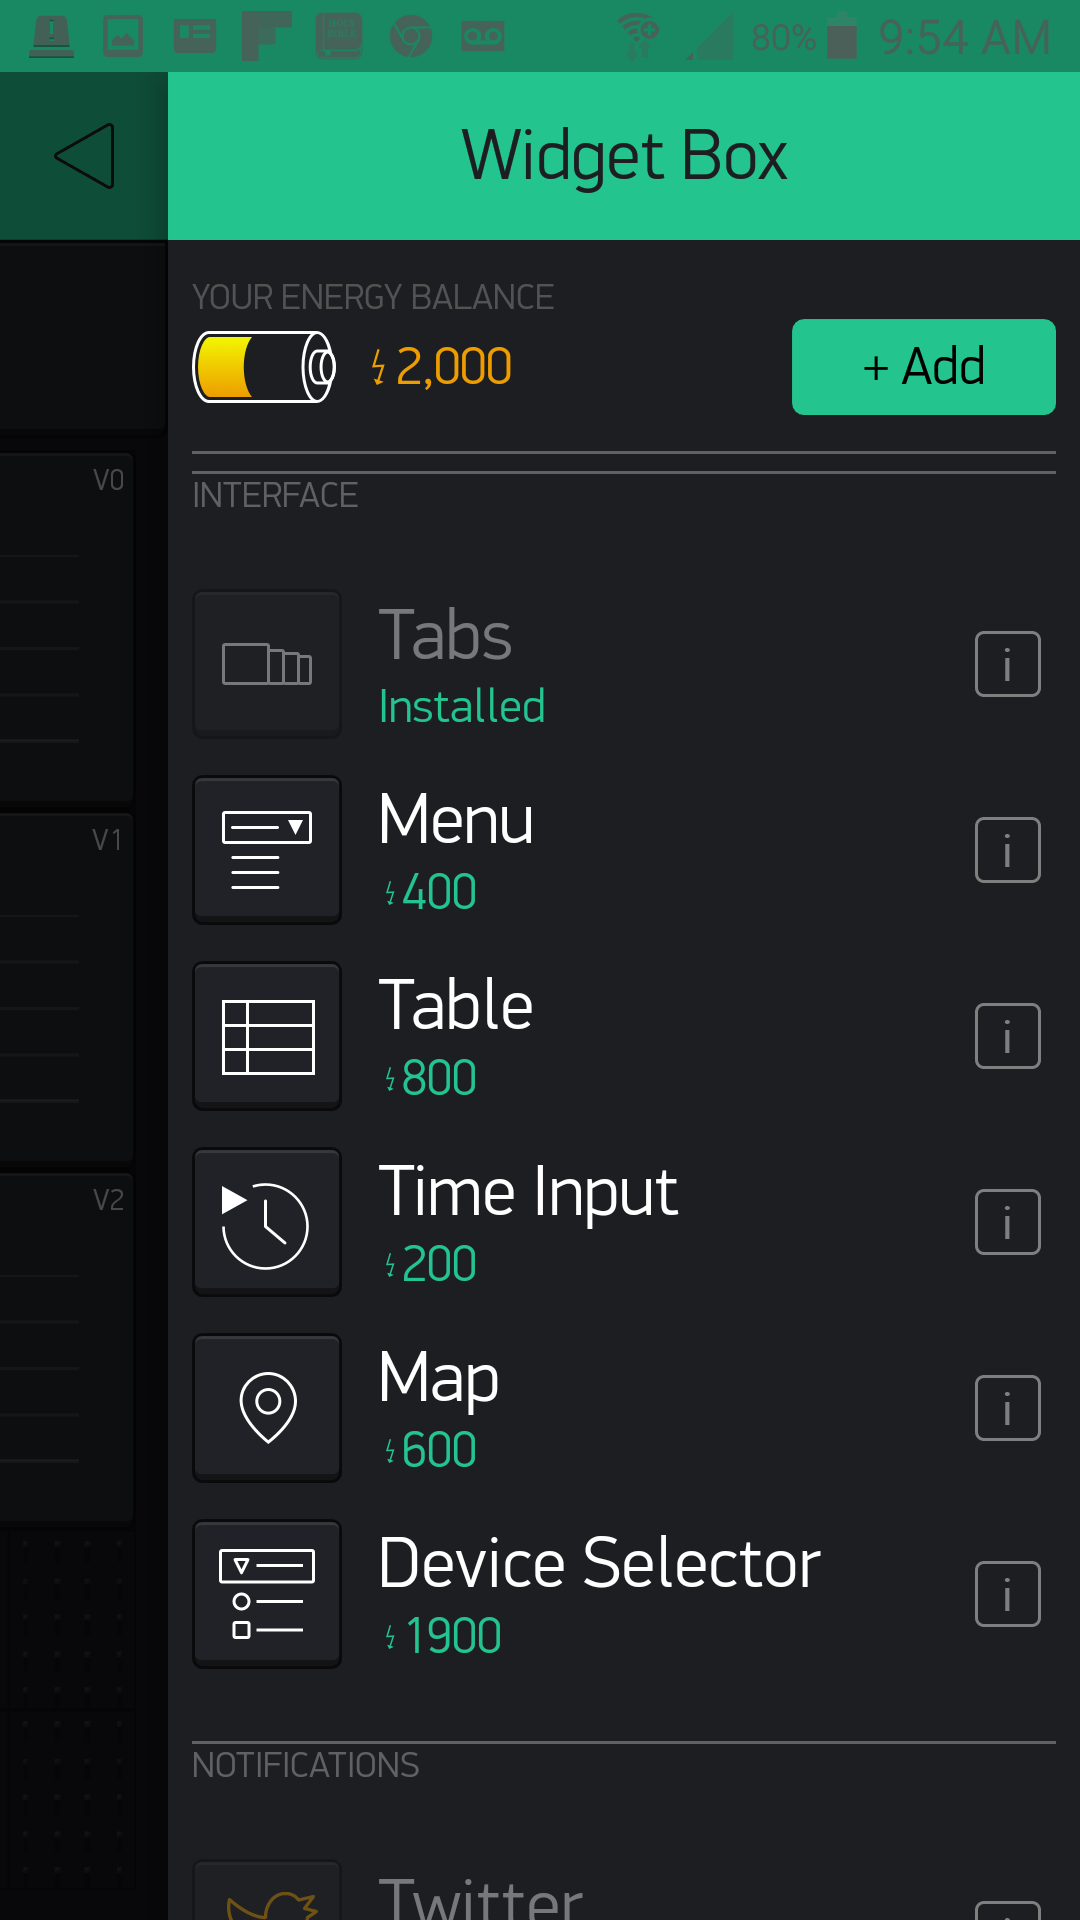
This Blynk app is going to start looking more and more like a professional-grade app. We will be adding tabs to your app so that you can switch between live line graphs of the temperature, humidity and pressure on the first page and a table of that data on the second tab. You can add tabs to your app using the Tabs widget under the Interface section of the Widget Box menu. In fact, take a bit to check out the other interface options you have at your disposal. You have actually already used one in the Time Input widget. These are really fun and add a certain amount of polish to your app.
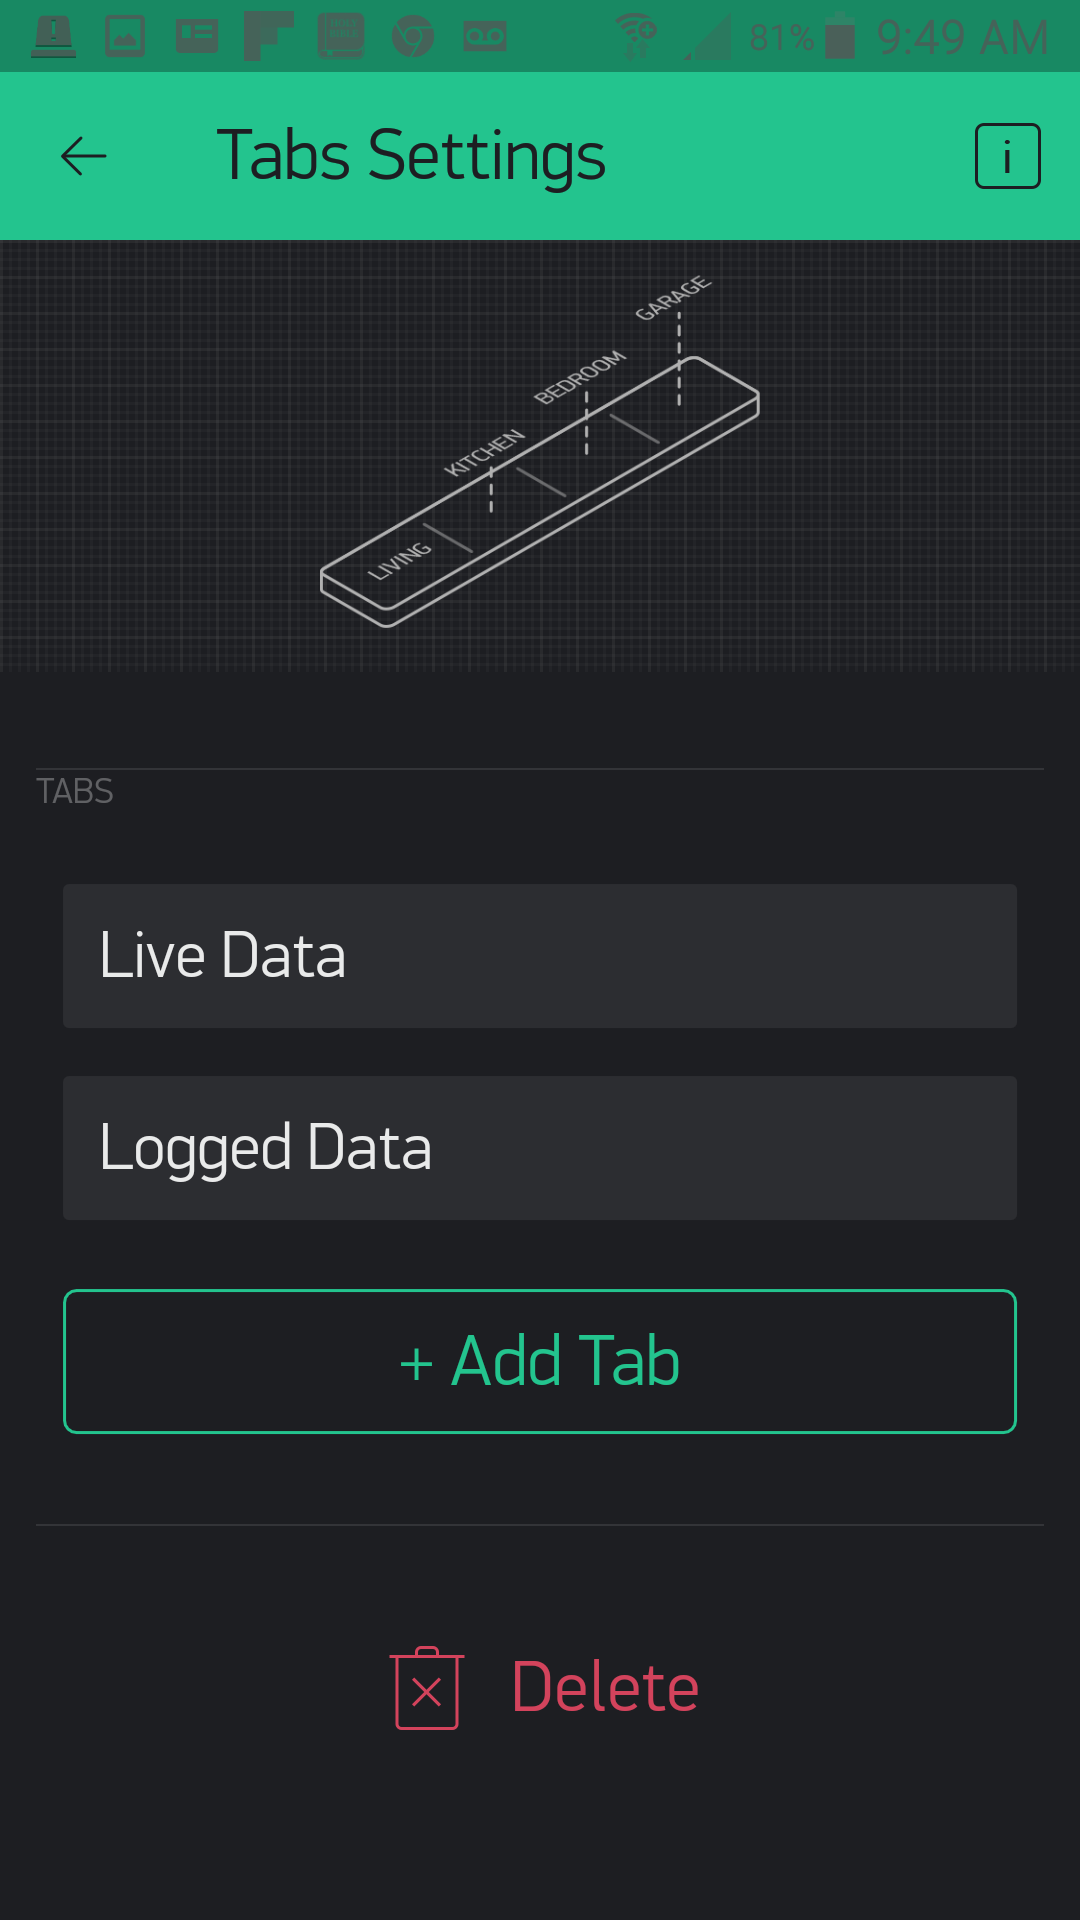
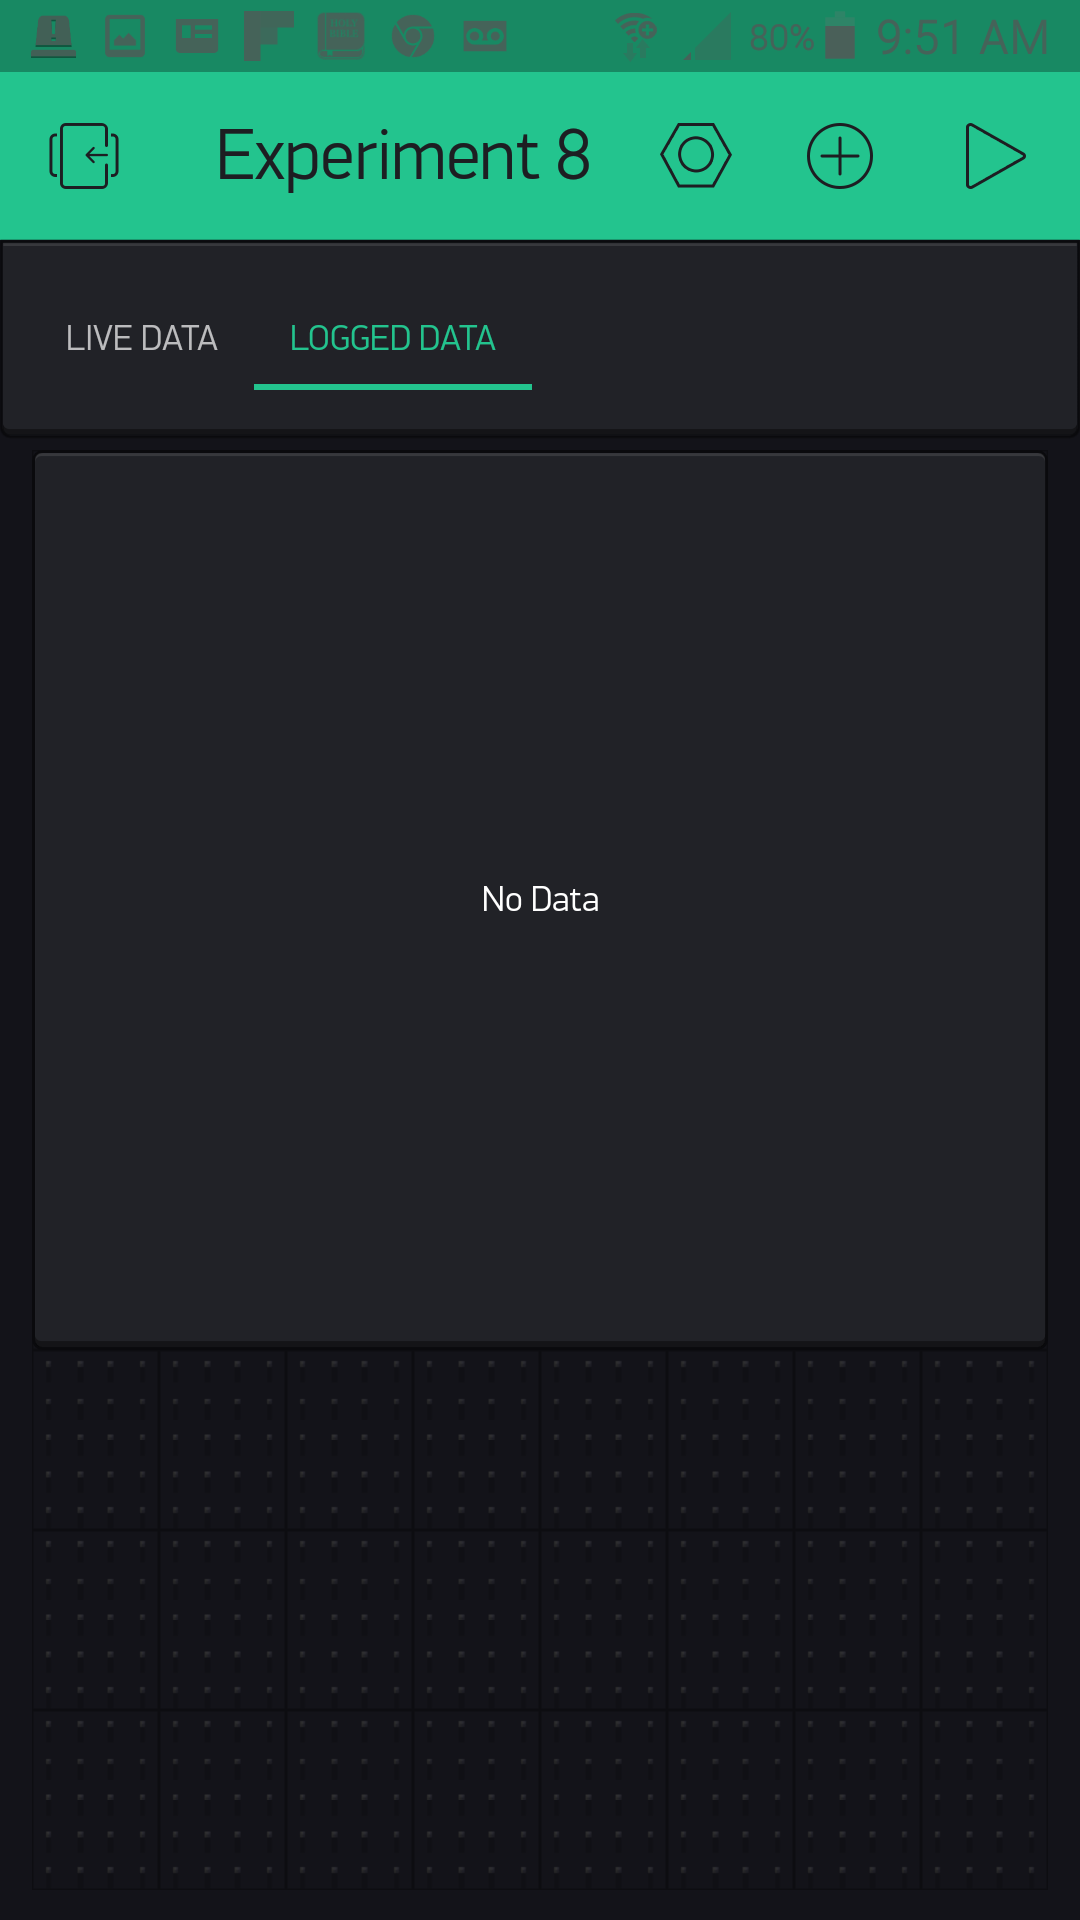
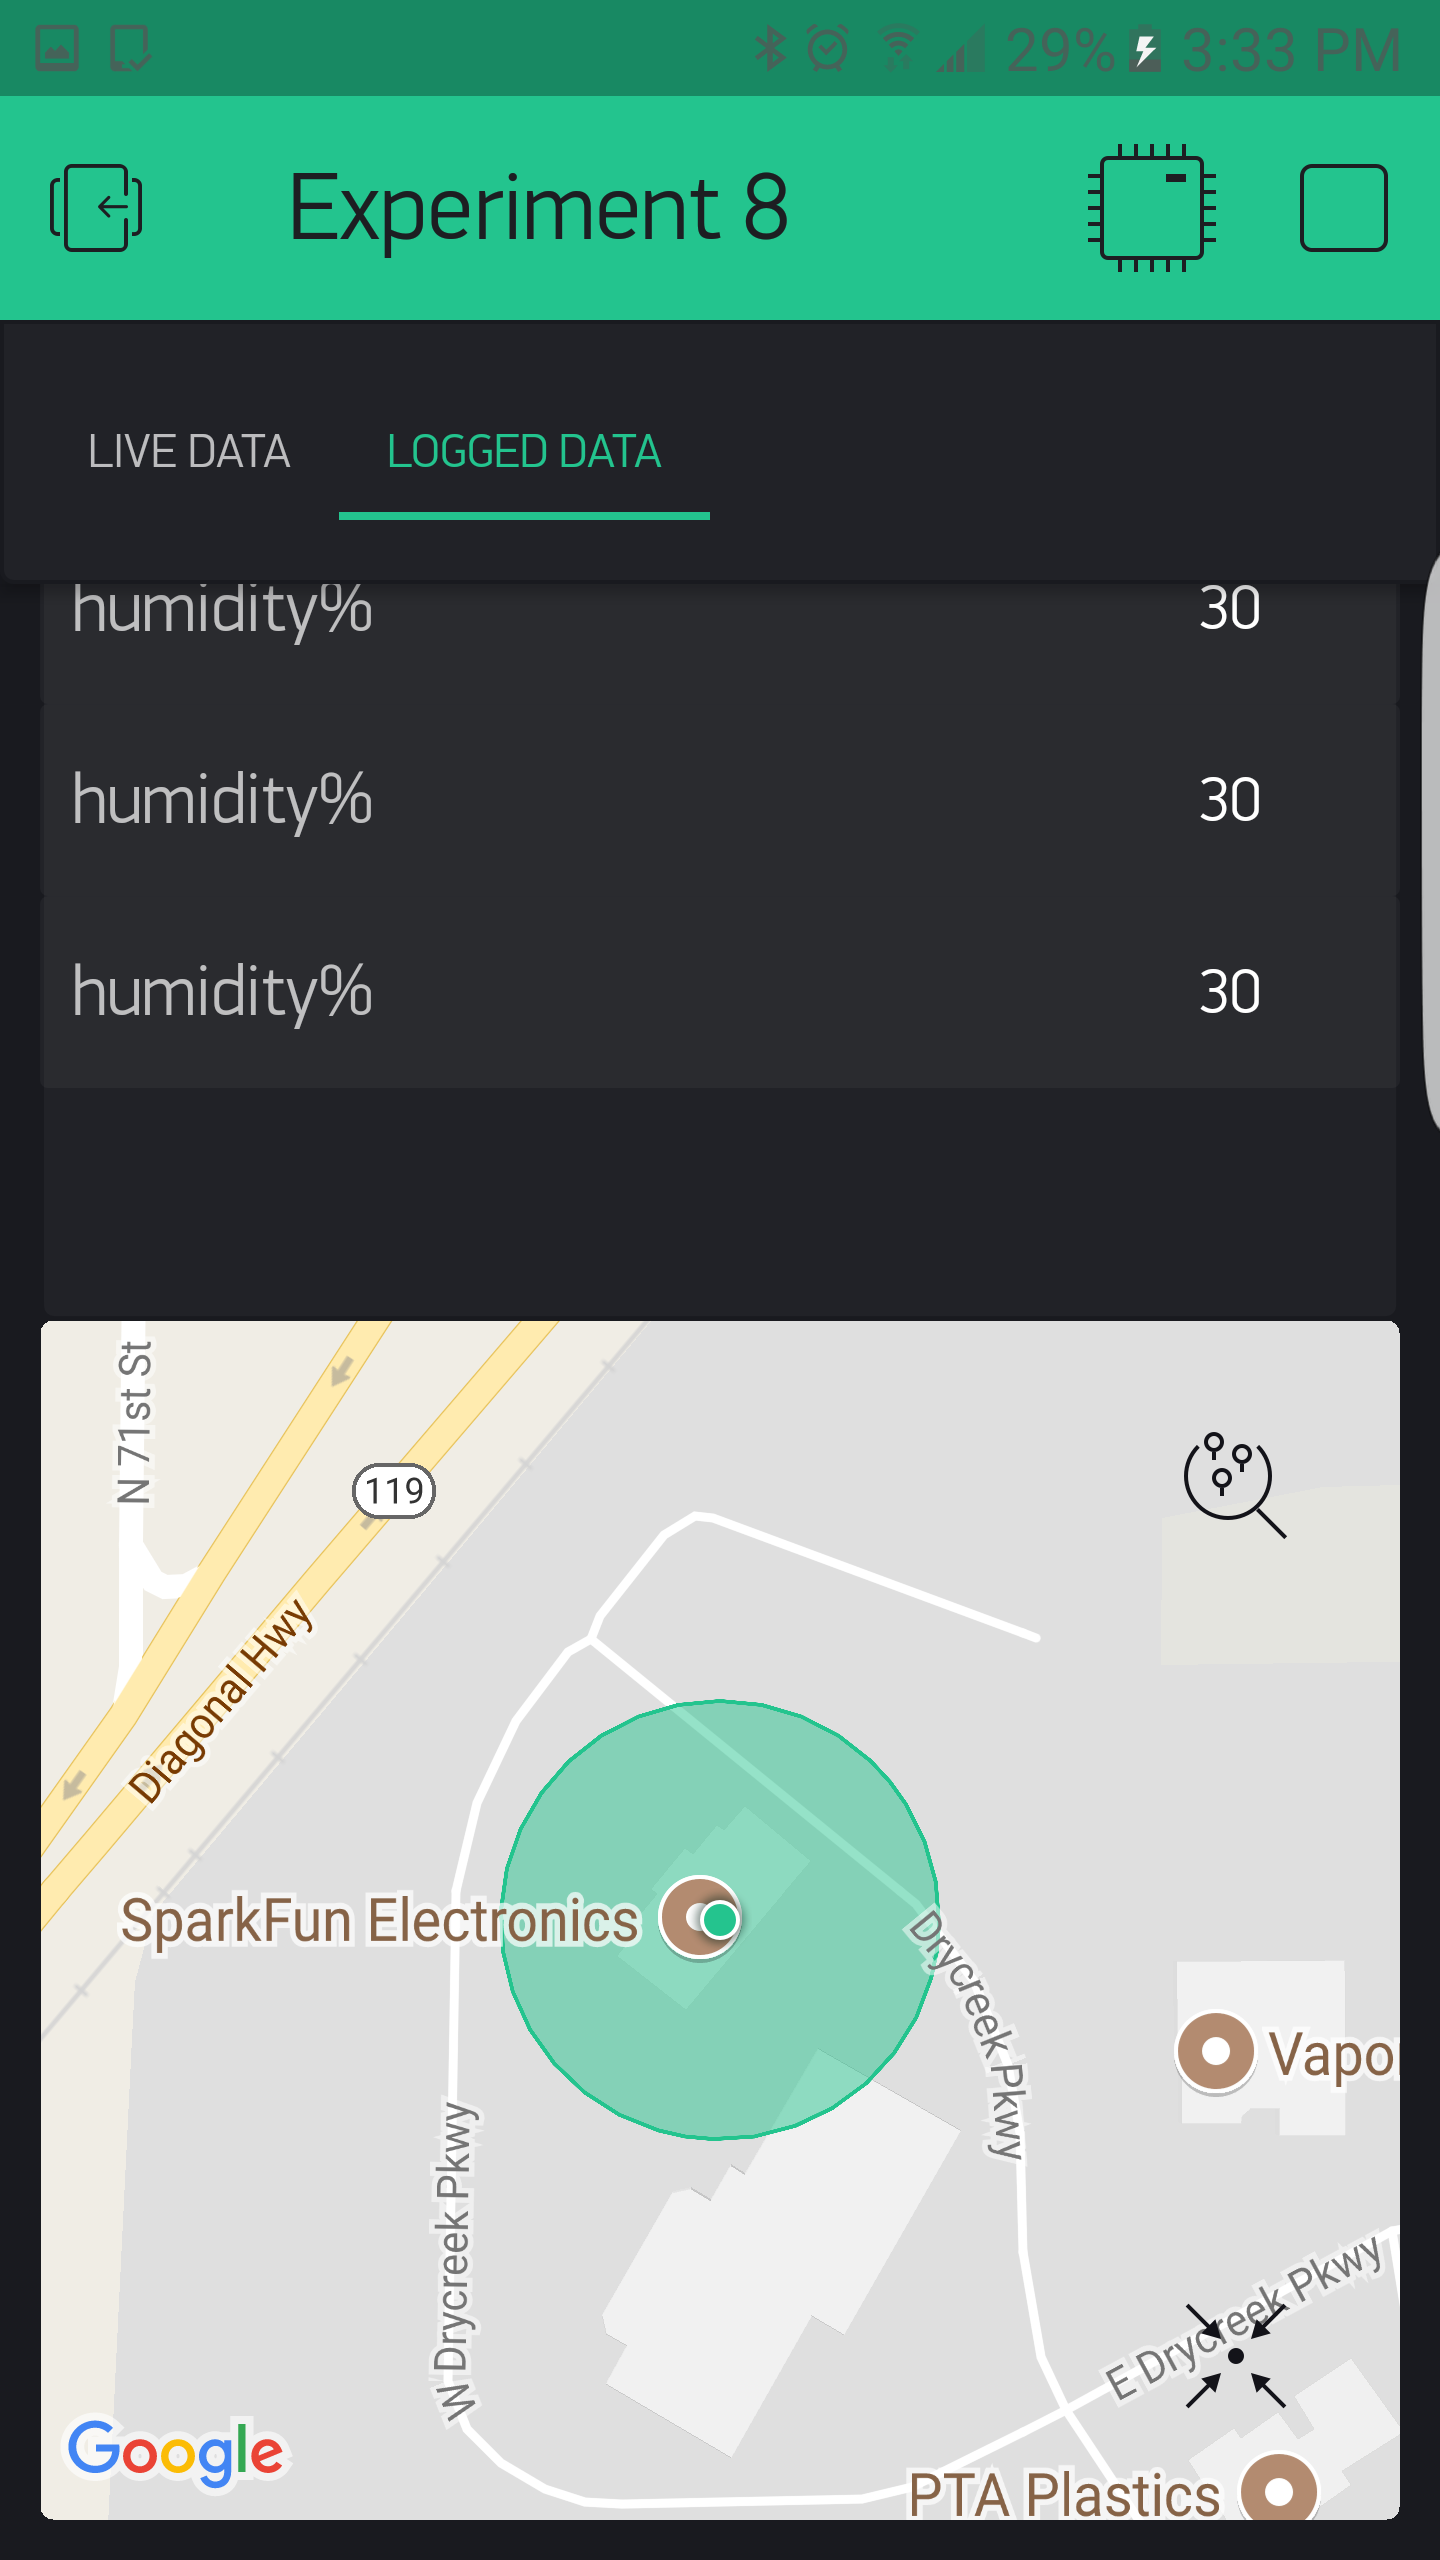
You add your Tabs widget like anything else, but it auto-populates itself at the top. From there you can open the settings like any other widget, name your tabs and even add more. We named our two tabs "Live Data" and "Logged Data."
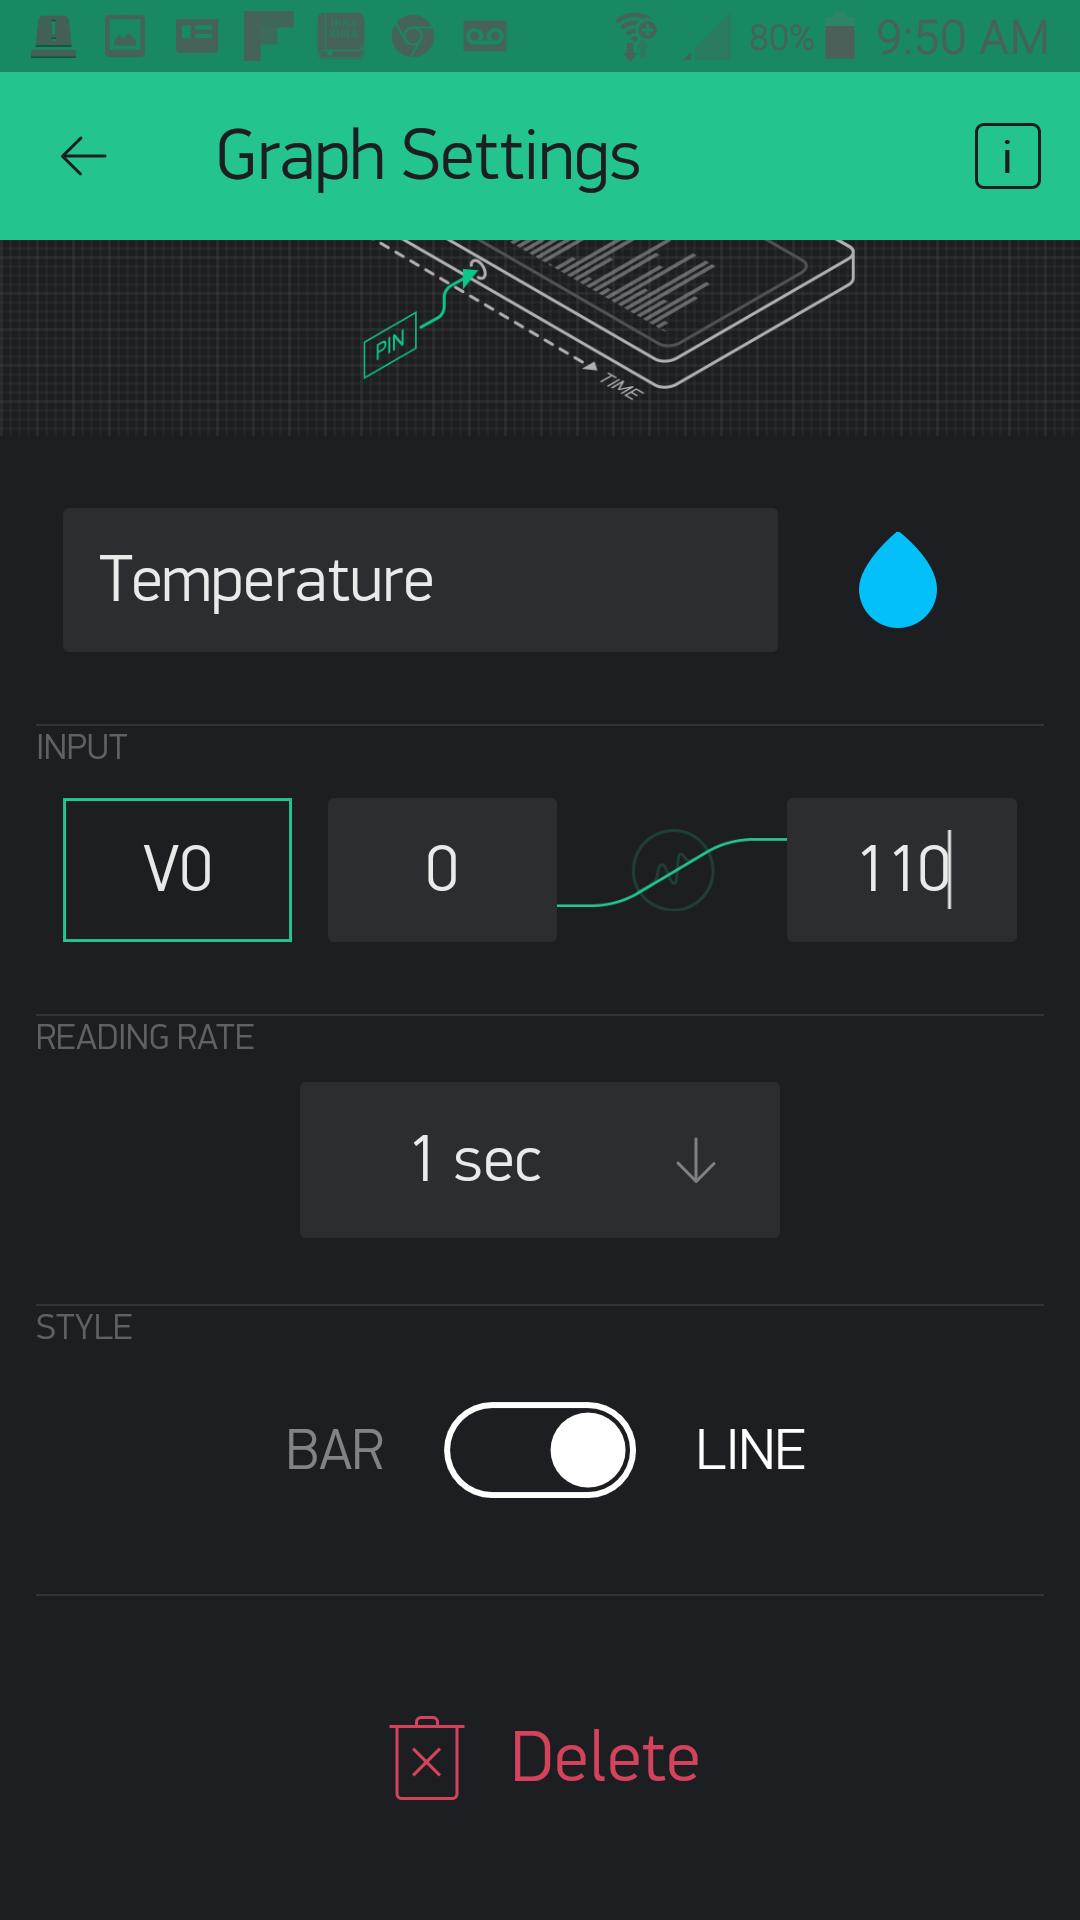
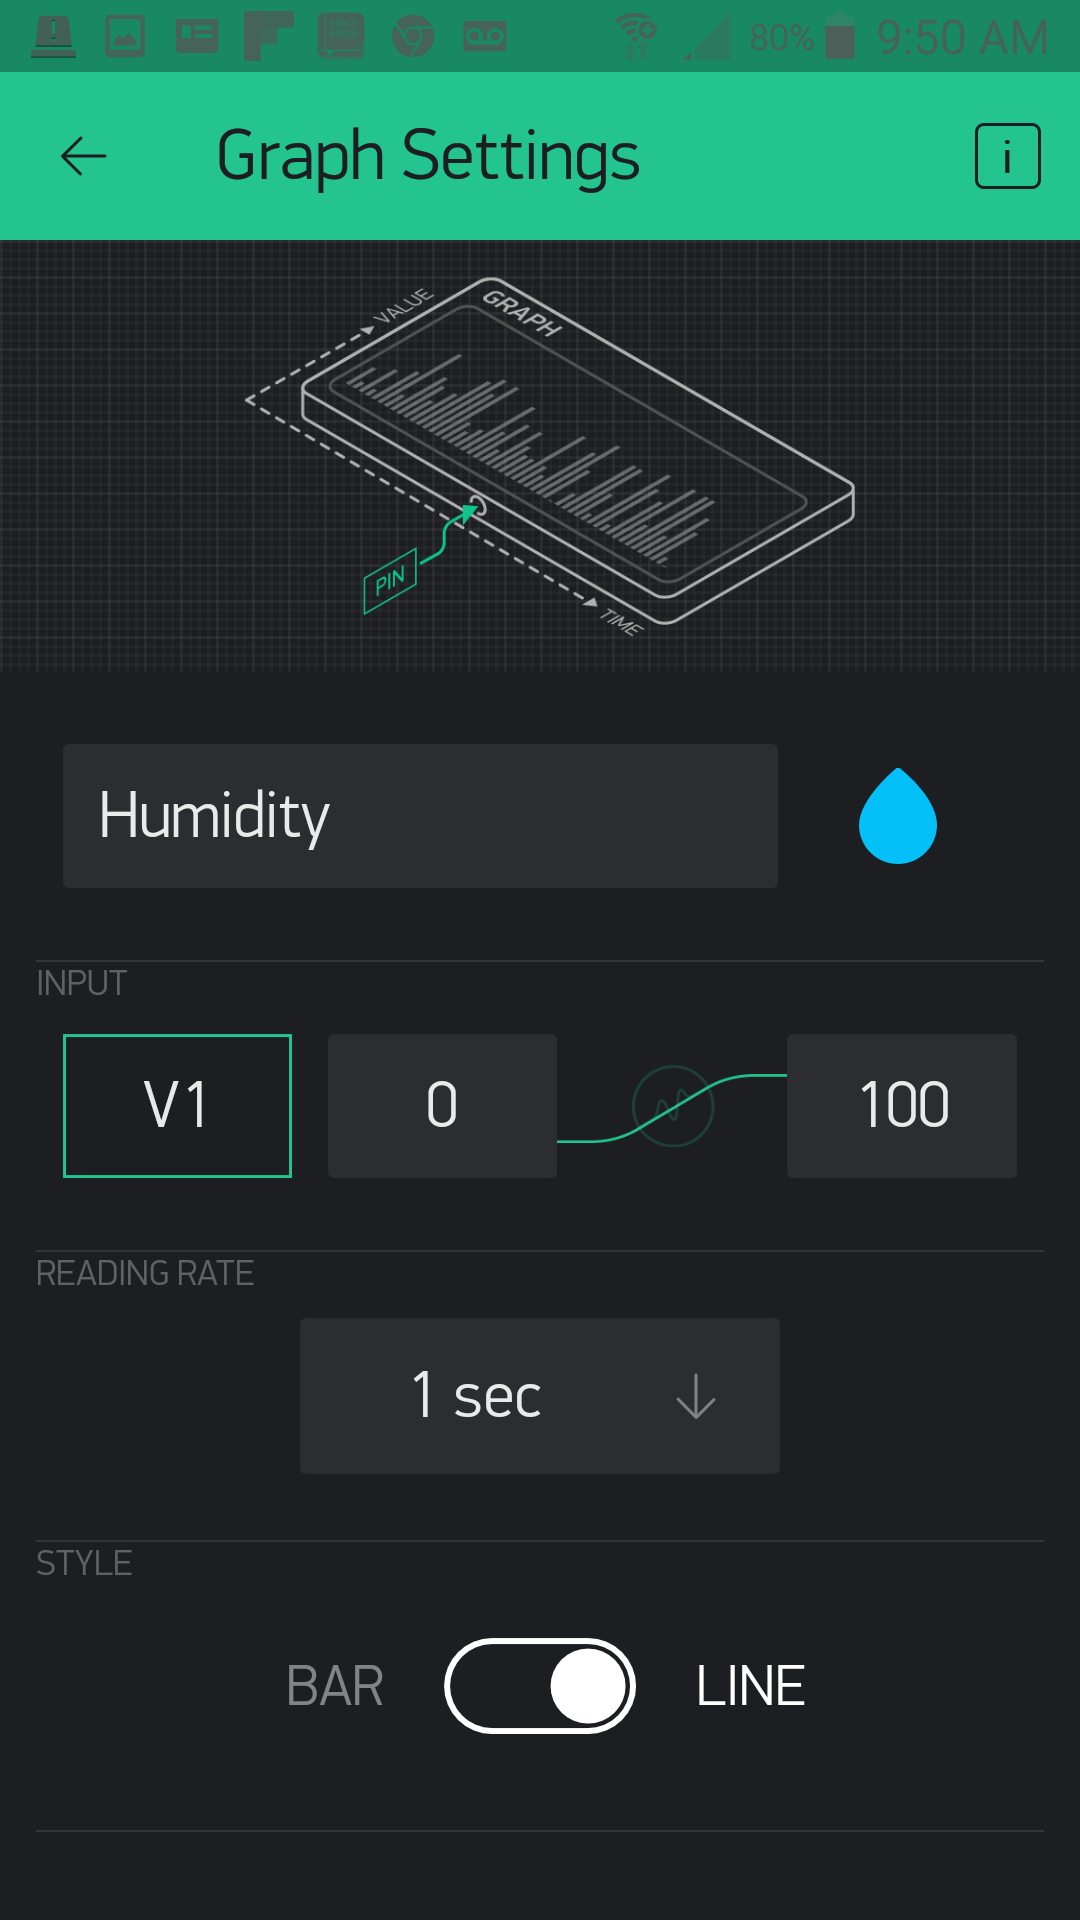
Now, working on the "live data" tab, we add three line graphs --- one for each of the pieces of data that we are graphing: Temperature, Humidity and Pressure. We set all three to line graphs.
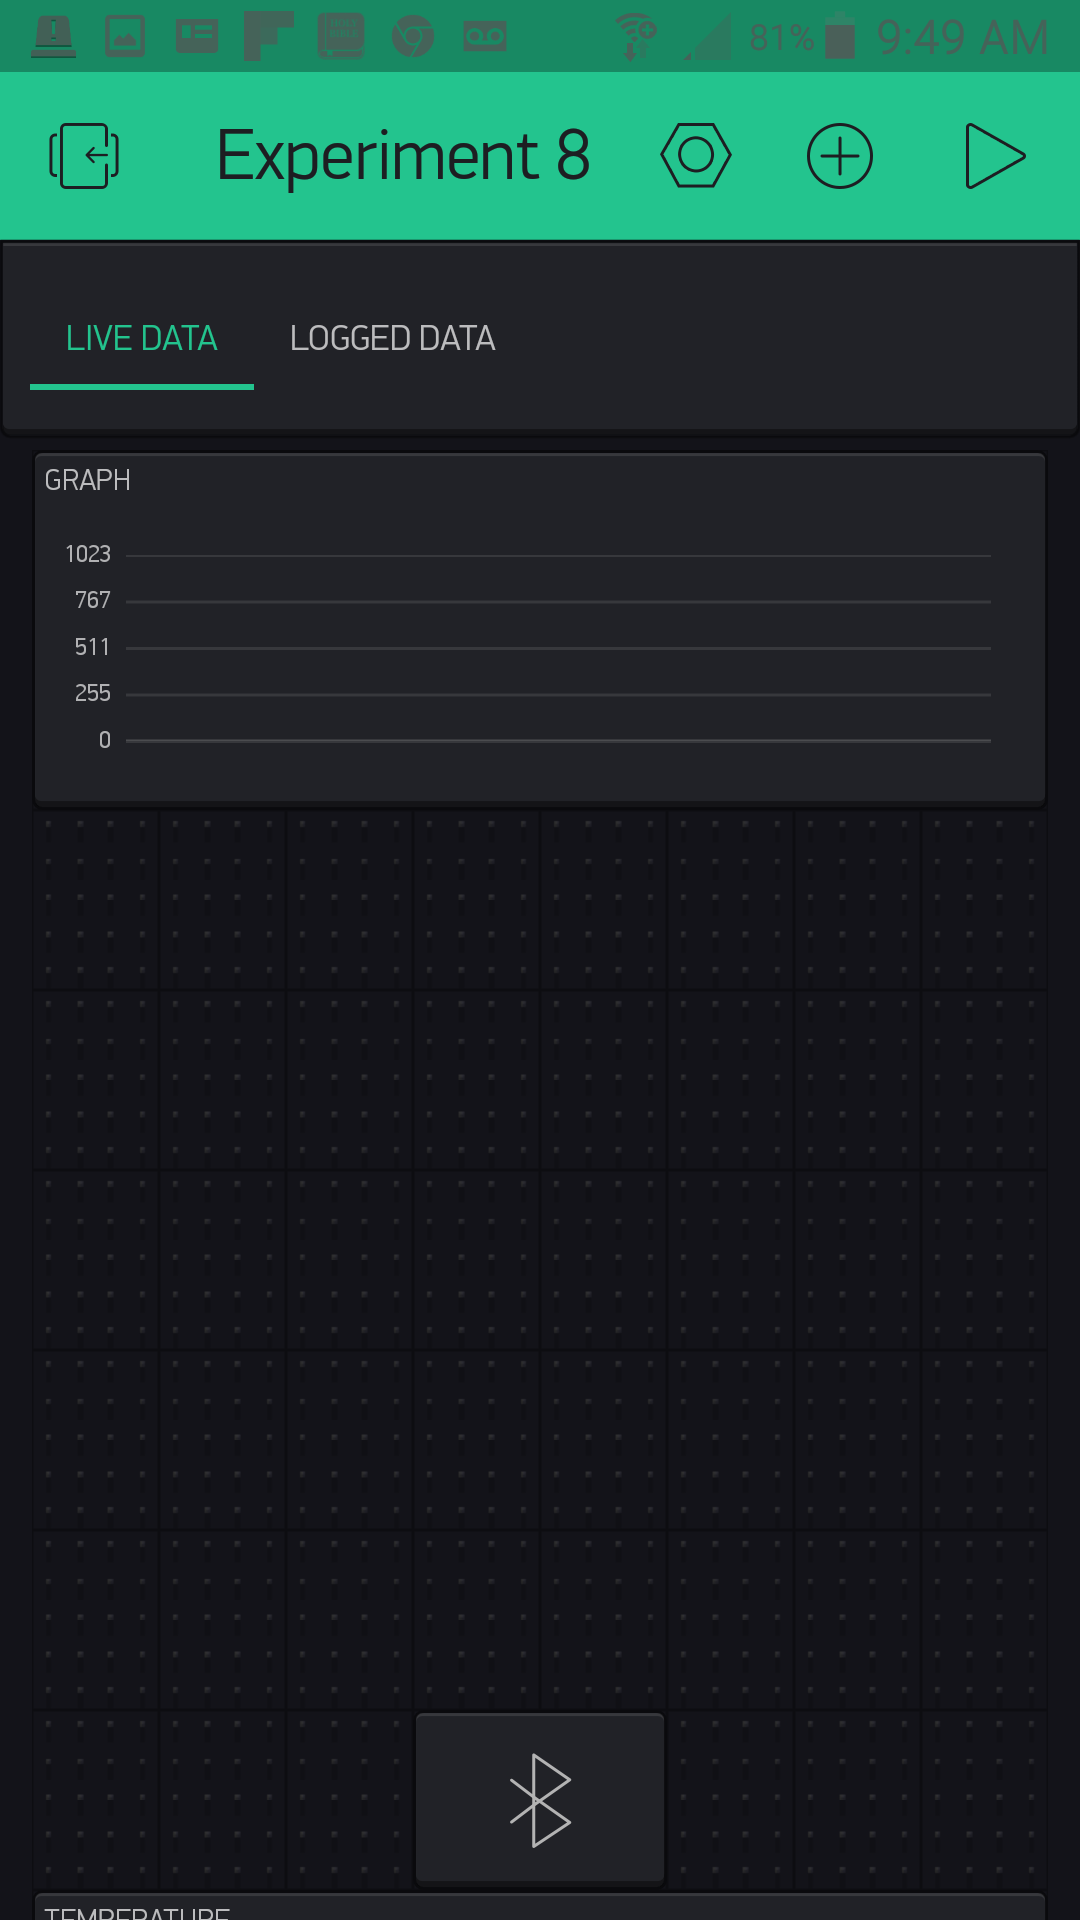
Temperature is set to pin V0, Humidity is pin V1, and Pressure is pin V2. You can also change the line colors to your taste. Also note that we set our expected value range to something that makes sense. Temperature, for example, is a range from 0 to 110, and humidity is 0 to 100.

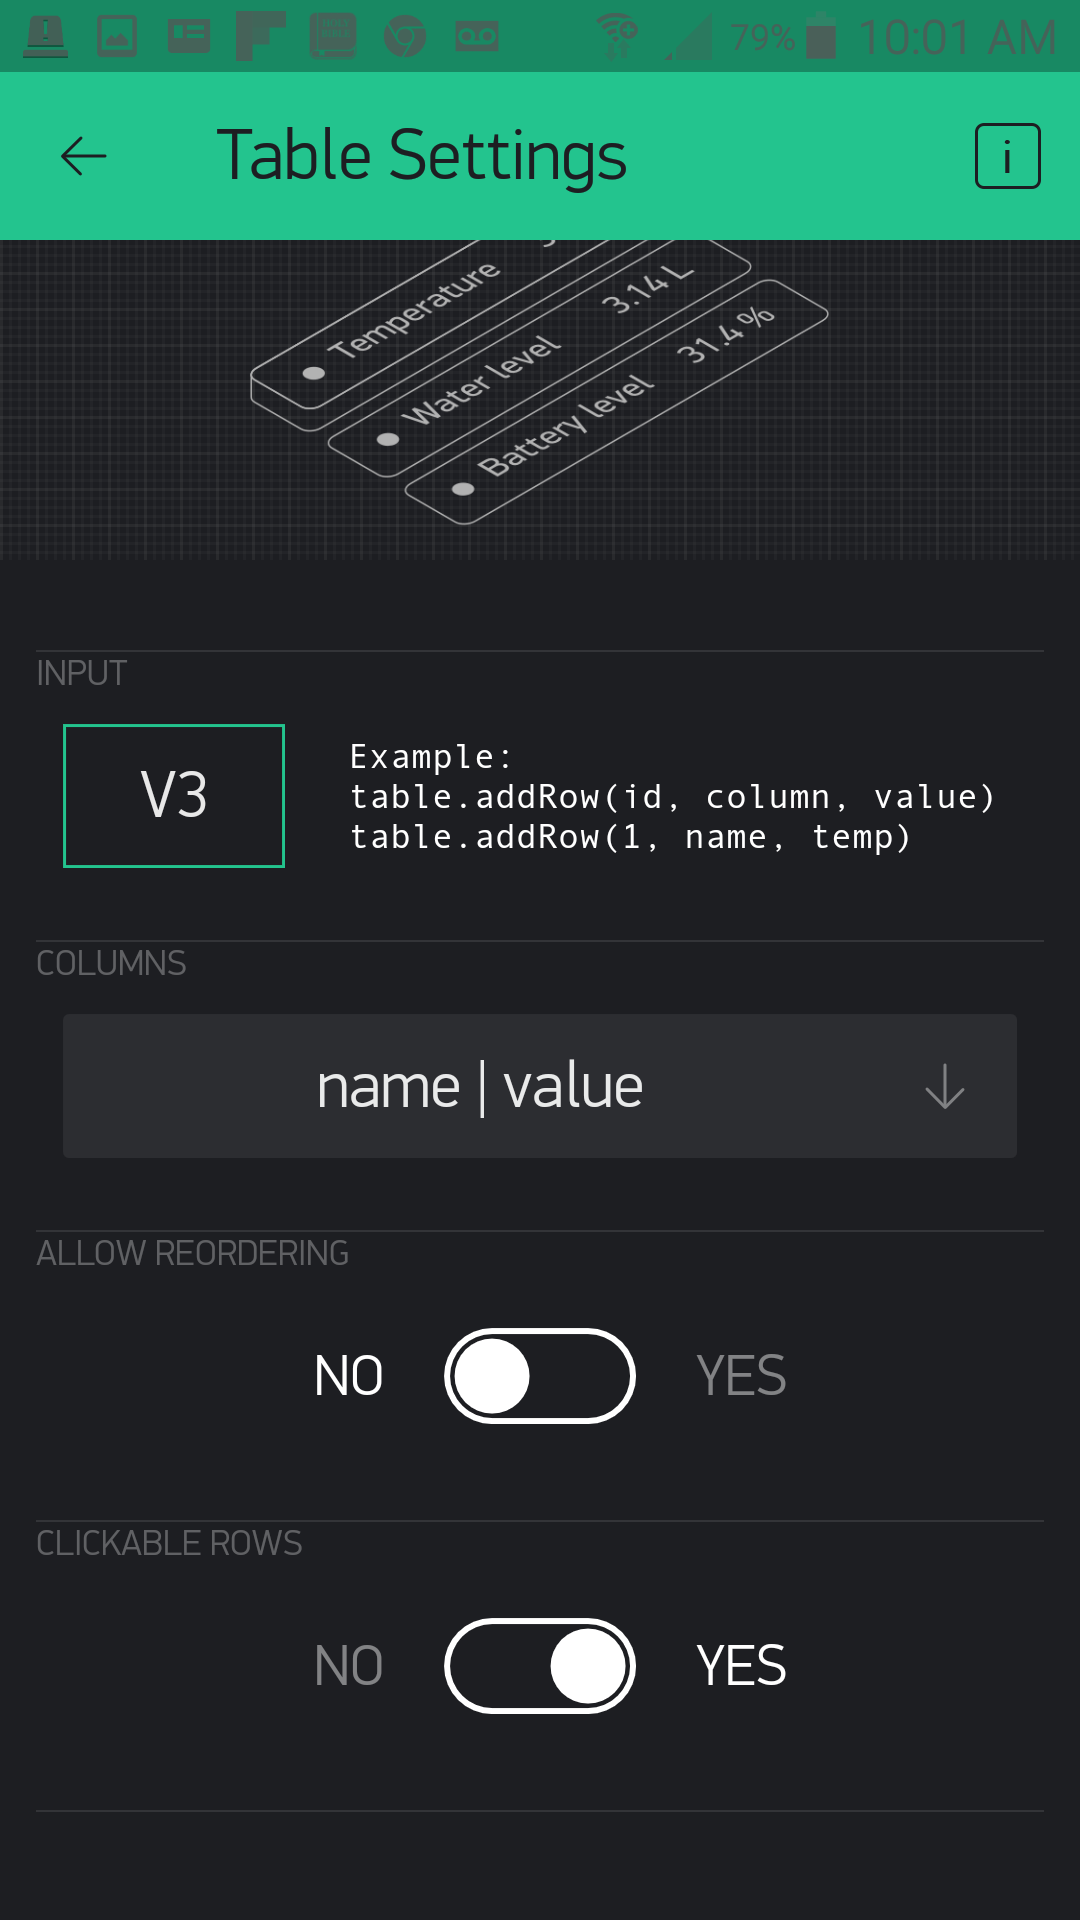
Next, we head over to the "Logged Data" tab and add a Table Widget. We want to connect the table to any data we send it over pin V3 in our Arduino sketch. In terms of the options, we set the columns to "name|value" and do not allow reordering since we will not be time-stamping this table (perhaps that is something you would like to add later).
With that we are done with our app setup, and it is now time to get the code uploaded and start sending data to the app so you can use this project to explore the atmospheric data around you!
Uploading Your Sketch
Installing the BME280 Arduino Library
You can copy and paste the following code into the Arduino IDE. Hit upload, and see what happens!
language:cpp
/********************************************************************************
SparkFun Around-The-Home SIK Expansion Kit, Experiment 8
SparkFun Electronics
Product URL

Read the Humidity, Temperature and atmospheric pressure of your house and then log and graph it real time in a Blynk app.

This example is written by: Derek Runberg, Educational Technologist

This sketch was written by SparkFun Electronics, with lots of help from the Arduino community.
This code is completely free for any use.

View circuit diagram and instructions at:https://learn.sparkfun.com/tutorials/around-the-home-expansion-kit

********************************************************************************/

//#define BLYNK_USE_DIRECT_CONNECT

/* Comment this out to disable prints and save space */
#define BLYNK_PRINT Serial

#include "SparkFunBME280.h"
#include "Wire.h"
#include <BlynkSimpleCurieBLE.h>
#include <CurieBLE.h>

// You should get Auth Token in the Blynk App.
// Go to the Project Settings (nut icon).
char auth[] = "YOUR_AUTH_TOKEN";

BLEPeripheral  blePeripheral;
BME280 mySensor;
BlynkTimer timer;

int temperature, humidity, pressure;
int rowIndex = 0;

void setup()
{
  //BME280 configuration
  mySensor.settings.commInterface = I2C_MODE;
  mySensor.settings.I2CAddress = 0x77;

  mySensor.settings.runMode = 3; //  3, Normal mode
  mySensor.settings.tStandby = 0; //  0, 0.5ms
  mySensor.settings.filter = 0; //  0, filter off
  //tempOverSample can be:
  //  0, skipped
  //  1 through 5, oversampling *1, *2, *4, *8, *16 respectively
  mySensor.settings.tempOverSample = 1;
  //pressOverSample can be:
  //  0, skipped
  //  1 through 5, oversampling *1, *2, *4, *8, *16 respectively
  mySensor.settings.pressOverSample = 1;
  //humidOverSample can be:
  //  0, skipped
  //  1 through 5, oversampling *1, *2, *4, *8, *16 respectively
  mySensor.settings.humidOverSample = 1;

  //start the sensor
  mySensor.begin();

  // Debug console
  Serial.begin(9600);

  delay(1000);

  blePeripheral.setLocalName("Exp_08");
  blePeripheral.setDeviceName("Exp_08");
  blePeripheral.setAppearance(384);

  Blynk.begin(blePeripheral, auth);

  blePeripheral.begin();

  Serial.println("Waiting for connections...");
  //set interval of 1 second to trigger the sendValues function
  timer.setInterval(100L, sendValues);
 }

void loop()
{
  blePeripheral.poll();
  Blynk.run();
}

//custom function called sendValues
void sendValues() {
  //write temperature and humidity to table

}

BLYNK_READ(V0){
  temperature = mySensor.readTempF();
  Blynk.virtualWrite(V0,temperature);
}

BLYNK_READ(V1){
  humidity = mySensor.readFloatHumidity();
  Blynk.virtualWrite(V1,humidity);
  Blynk.virtualWrite(V3, "add", rowIndex, "humidity%", humidity);
  rowIndex++;
}

BLYNK_READ(V2){
  pressure = mySensor.readFloatPressure() / 100;
  Blynk.virtualWrite(V2,pressure);
}
Code to Note
This sketch is not that complicated in terms of anything new from the Blynk API; it is using the BME280 in Arduino that will be the new kid on the block for the Code to Note.
#include "SparkFunBME280.h"
To simplify the programming in Arduino to use the BME280, we created a library to keep things clean and straightforward for you. You have to include that library in your sketch to be able to use it.
BME280 mySensor;
You then create a BME280 object. We called ours "mySensor," but you can call it whatever you like!
language:cpp
  //BME280 configuration
  mySensor.settings.commInterface = I2C_MODE;
  mySensor.settings.I2CAddress = 0x77;

  mySensor.settings.runMode = 3; //  3, Normal mode
  mySensor.settings.tStandby = 0; //  0, 0.5ms
  mySensor.settings.filter = 0; //  0, filter off
  //tempOverSample can be:
  //  0, skipped
  //  1 through 5, oversampling *1, *2, *4, *8, *16 respectively
  mySensor.settings.tempOverSample = 1;
  //pressOverSample can be:
  //  0, skipped
  //  1 through 5, oversampling *1, *2, *4, *8, *16 respectively
  mySensor.settings.pressOverSample = 1;
  //humidOverSample can be:
  //  0, skipped
  //  1 through 5, oversampling *1, *2, *4, *8, *16 respectively
  mySensor.settings.humidOverSample = 1;
The BME280 is a great sensor because you have a lot of options in terms of how to use it, and it can be configured in a number of different ways. But, it can also be daunting when you first approach using it. If you want to learn more about these settings, we highly recommend reading the Hookup Guide for the BME280; otherwise just leave everything as is.
mySensor.begin();
After all of that we start using the sensor by calling mySensor.begin(). This applies all of the settings changes and starts reading values from the sensor.
language:cpp
BLYNK_READ(V0){
 temperature = mySensor.readTempF();
 Blynk.virtualWrite(V0,temperature);
}
As in the previous experiment, we put the BLYNK_READ() event function to use. This time each graph has its own event function. In our example code they are all set to the same timing, but you could easily change each one to make sense for your application. For example, you could probably get away with not tracking pressure as often as you would temperature or humidity.
language:cpp
 Blynk.virtualWrite(V3, "add", rowIndex, "humidity%", humidity);
 rowIndex++;
You may have noticed that the humidity graph event function (reading on pin V1) has a little extra code in it. This is because we decided to track the humidity percentage in a table on the "Logged Data" tab. To add data to a table you use the virtualWrite() method, but add a few extra parameters. You add the pin that is connected to the table --- in this case V3 --- the command to "add" to the table, the row you want to add data to, the title of the row and finally the data. We are adding a new row in a running manner by incrementing a variable called rowIndex.
What You Should See
[Video]
As a bonus to this experiment, we added a Map Widget just below the table to give our location, which is based off of our phone. Check it out!
Troubleshooting
Blynk Shortcut!
If you are having troubles duplicating the functionality above in the Blynk app, scan this QR code with Blynk to get a clone of this experiment!