AD8232 Heart Rate Monitor Hookup Guide
 CaseyTheRobot
 Introduction
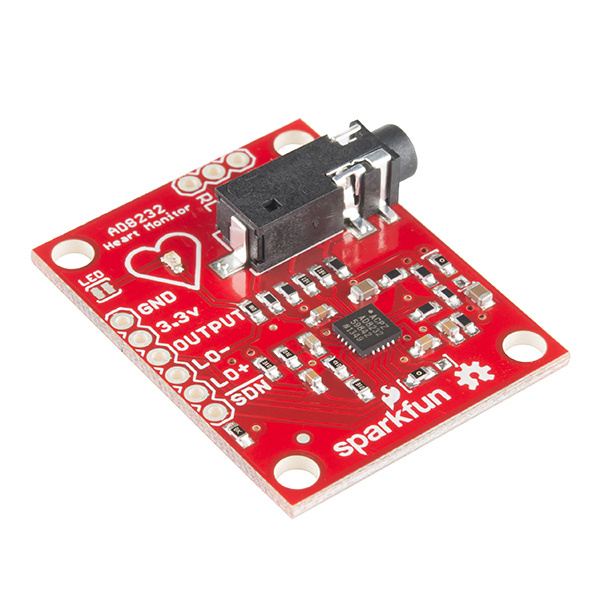
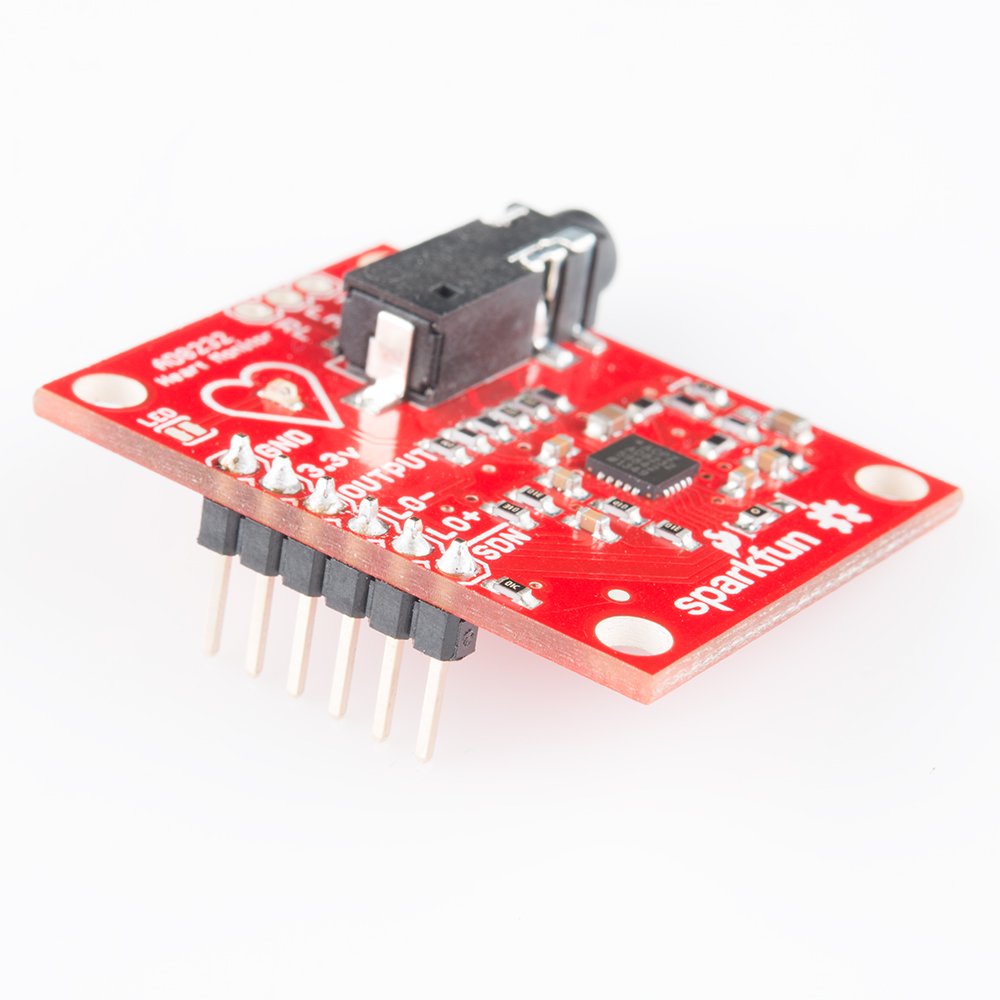
The AD8232 is a neat little chip used to measure the electrical activity of the heart. This electrical activity can be charted as an ECG or Electrocardiogram. Electrocardiography is used to help diagnose various heart conditions. Now for the disclaimer:
Covered in this Tutorial
In this tutorial, we will go over the basics for getting your AD8232 Heart Rate Monitor up and running. First, an overview of the board and all its features will be presented. Then, we'll show you how hook it up to your favorite microcontroller and how to create visual data using Processing.
Suggested Reading
If you are not familiar with any of the following concepts, you may want to review them before moving ahead.
Serial Communication
How to Power a Project
Working with Wire
What is an Arduino?
Connecting Arduino to Processing
Serial Terminal Basics
Understanding the ECG
In general terms, lets look at what an ECG is representing and how we're able to sense it. The ECG is separated into two basic Intervals, the PR Interval and the QT Interval, described below.
Note: All information comes from the Waves and Intervals section of the ECG Wikipedia page .
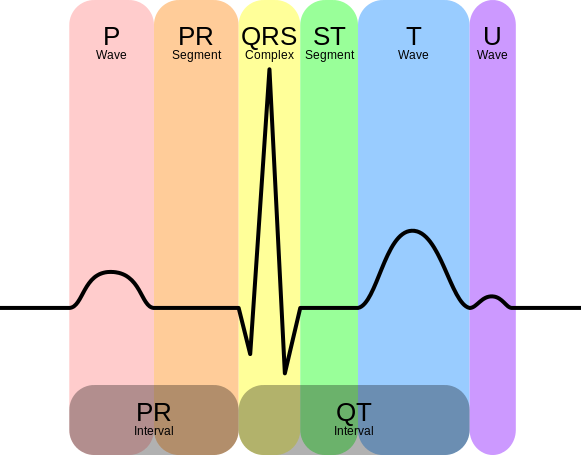

PR Interval
The PR interval is the initial wave generated by an electrical impulse traveling from the right atrium to the left. The right atrium is the first chamber to see an electrical impulse. This electrical impulse causes the chambers to "depolarize". This forces it to contract and drain deoxygenated blood from both the Superior and Inferior vena cava into the right ventricle. As the electrical impulse travels across the top of the heart it then triggers the left atrium to contract. The left atrium is responsible for receiving newly oxygenated blood from the lungs into the left ventricle via the left and right pulmonary veins. The pulmonary veins are red in the diagram because they are carrying oxygenated blood. They are still called veins because veins carry blood towards the heart. Science!
QT Interval
The QT Interval is where things get really interesting. The QRS is a complex process that generates the signature "beep" in cardiac monitors. During QRS both ventricles begin to pump. The right ventricle begins to pump deoxygenated blood into the lungs through the left and right pulmonary arteries. The pulmonary arteries are blue in the diagram because they are carrying deoxygenated blood. They are still called arteries because arteries carry blood away the heart. Science, Again! The left ventricle is also begining to pump freshly oxygenated blood through the aorta and into the rest of the body. After the initial contraction comes the ST segment. The ST segment is fairly quiet electrically as it is the time where the ventricals waiting to be "re-polarized". Finally the T wave becomes present to actively "re-ploarize", or relax the ventricles. This relaxation phase resets the ventricles to be filled again by the atriums.
Connecting the Hardware
In this guide, we'll connect the AD8232 Breakout to an Arduino microcontroller. We will build a simple cardiac monitor that will allow you to measure the electrical activity of the heart in real time!
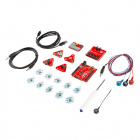
Required Materials
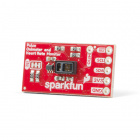
Pin Connections
The AD8232 Heart Rate Monitor breaks out nine connections from the IC. We traditionally call these connections "pins" because they come from the pins on the IC, but they are actually holes that you can solder wires or header pins to.
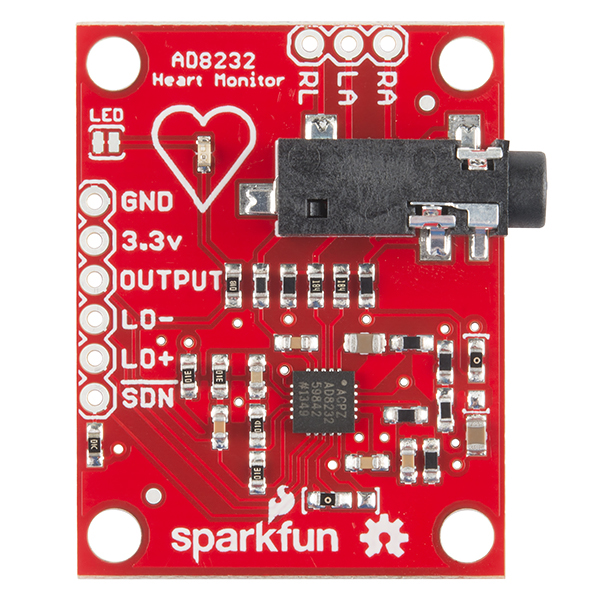
We'll connect five of the nine pins on the board to your Arduino. The five pins you need are labeled GND, 3.3v, OUTPUT, LO-, and LO+.
| Board Label | Pin Function | Arduino Connection |
| GND | Ground | GND |
| 3.3v | 3.3v Power Supply | 3.3v |
| OUTPUT | Output Signal | A0 |
| LO- | Leads-off Detect - | 11 |
| LO+ | Leads-off Detect + | 10 |
| SDN | Shutdown | Not used |
Connecting Headers to the Board
You can use any method you'd like to make your connections to the board. For this example, we'll solder on a five-pin length of male-male header strip and use a breadboard and jumpers to make our connections.
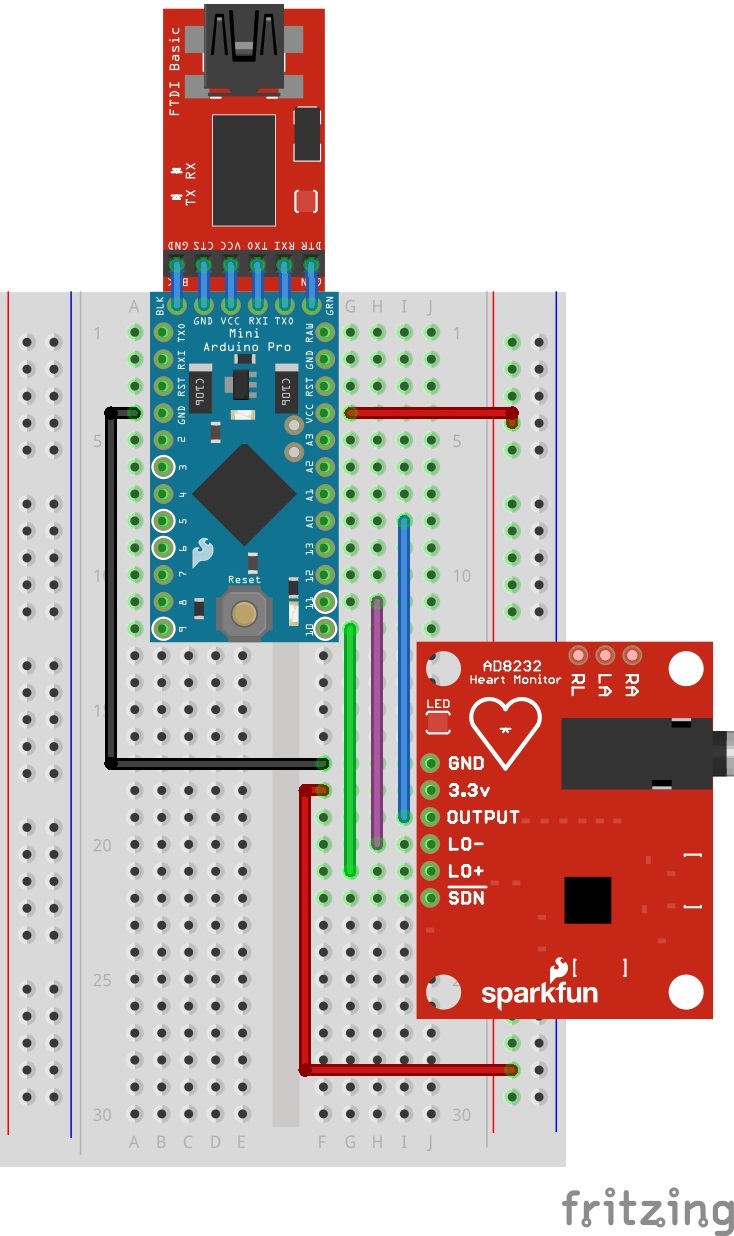
Circuit Diagram
Follow the diagram below, to make necessary connections. The SDN pin is not used in this demo. Connecting this pin to ground or "LOW" on a digital pin will power down the chip. This is useful for low power applications.
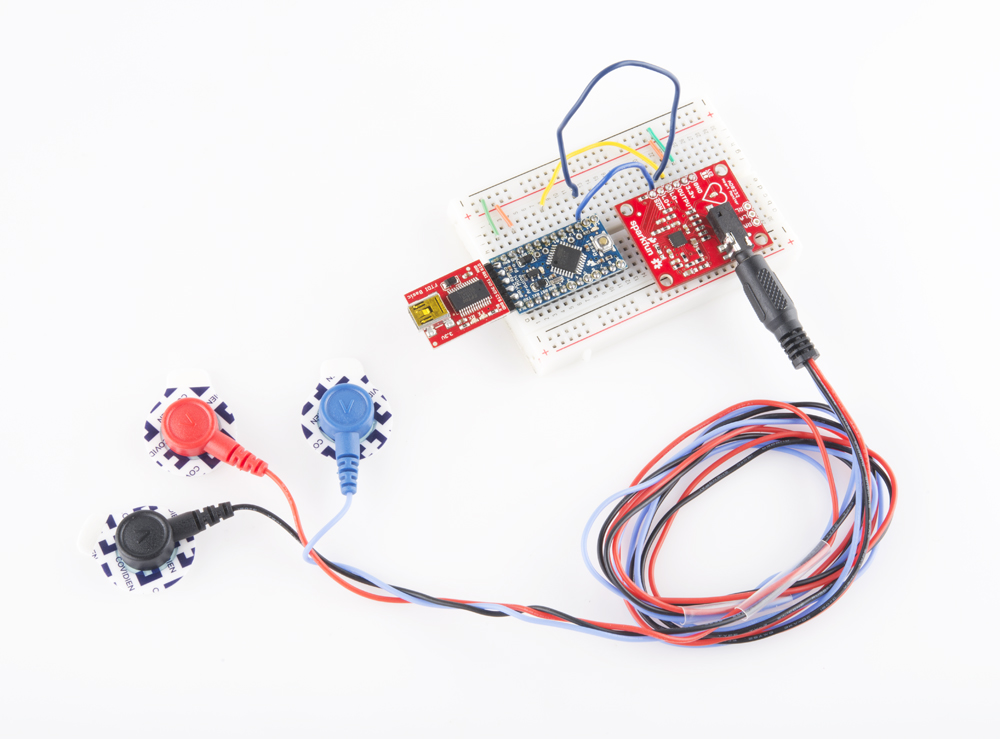
Sensor Pad Placement
Now that the electronics are complete, let's look at sensor pad placement. It is recommended to snap the sensor pads on the leads before application to the body.
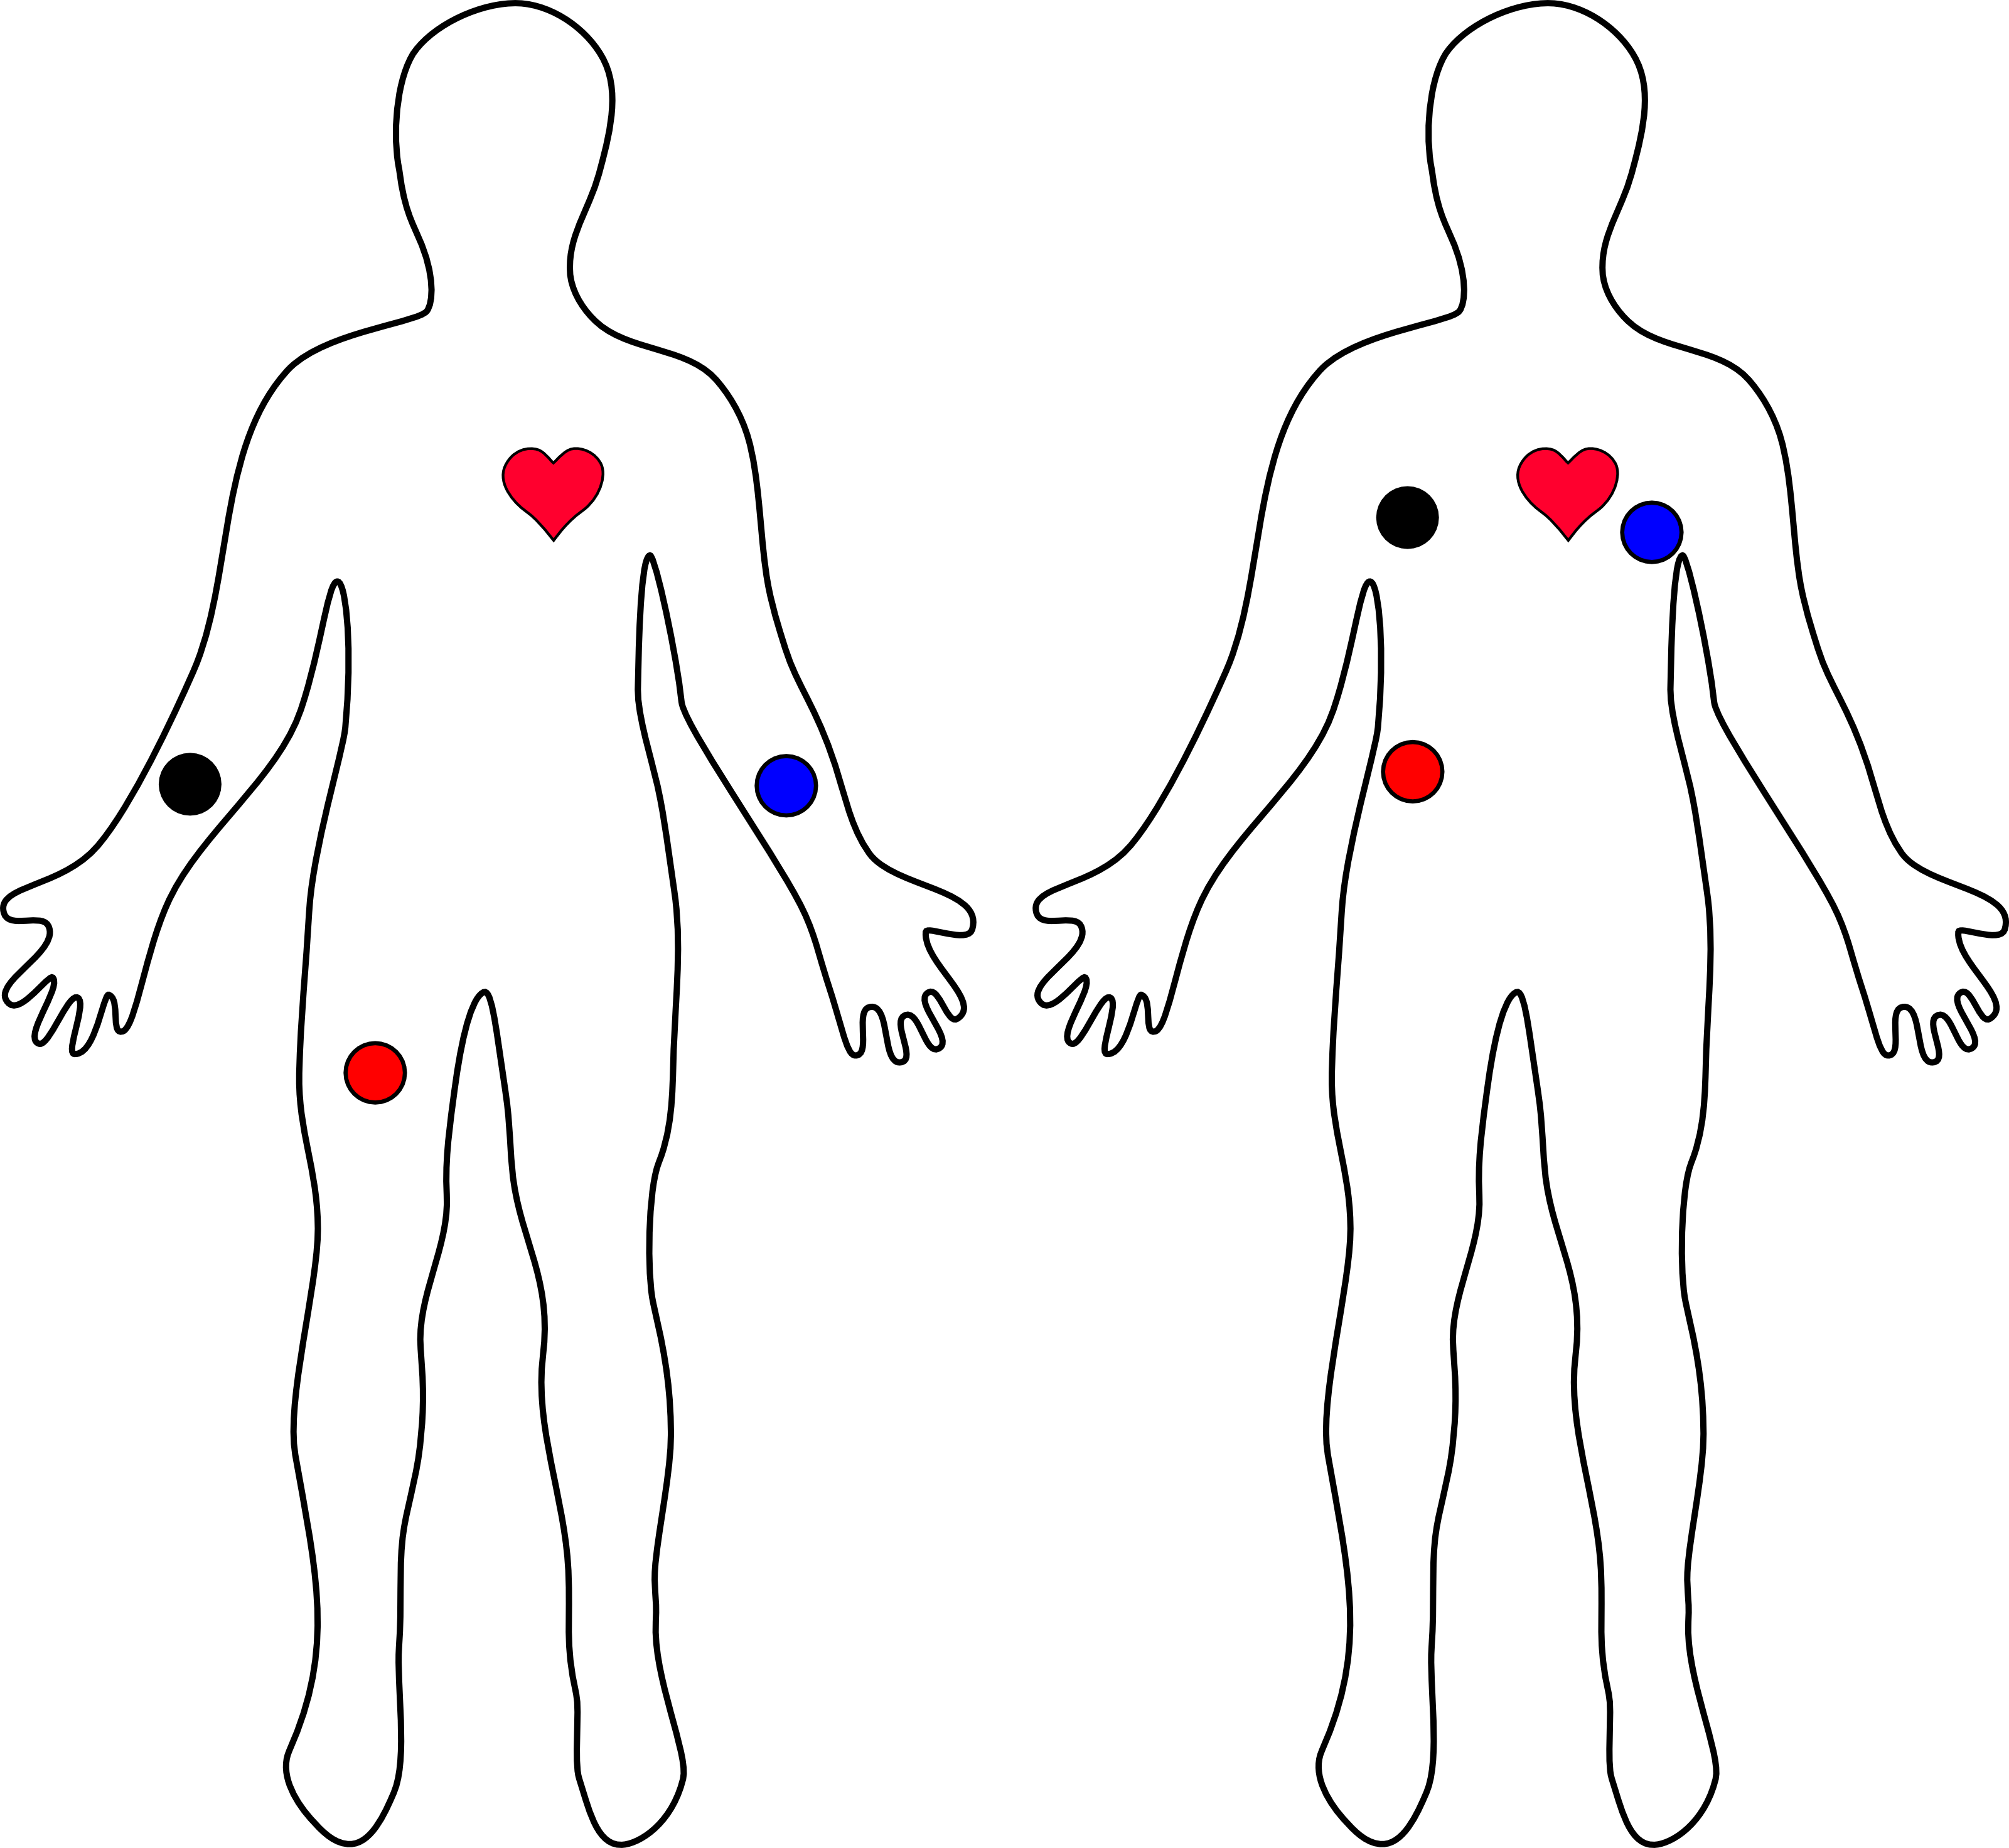
The closer to the heart the pads are, the better the measurement. The cables are color coded to help identify proper placement as shown in the table based on Einthoven's triangle. The sensors can be placed on the forearms and leg as shown on the diagram on the left. Or they can be placed on the chest near the arms and above the right, lower abdomen (i.e. just above the right hip) as shown on the diagram on the right.
| Cable Color | Signal |
| Black | RA (Right Arm) |
| Blue | LA (Left Arm) |
| Red | RL (Right Leg) |
Arduino Example
By this point, you should have the hardware connected and ready. The example sketch can be found in the GitHub repository.
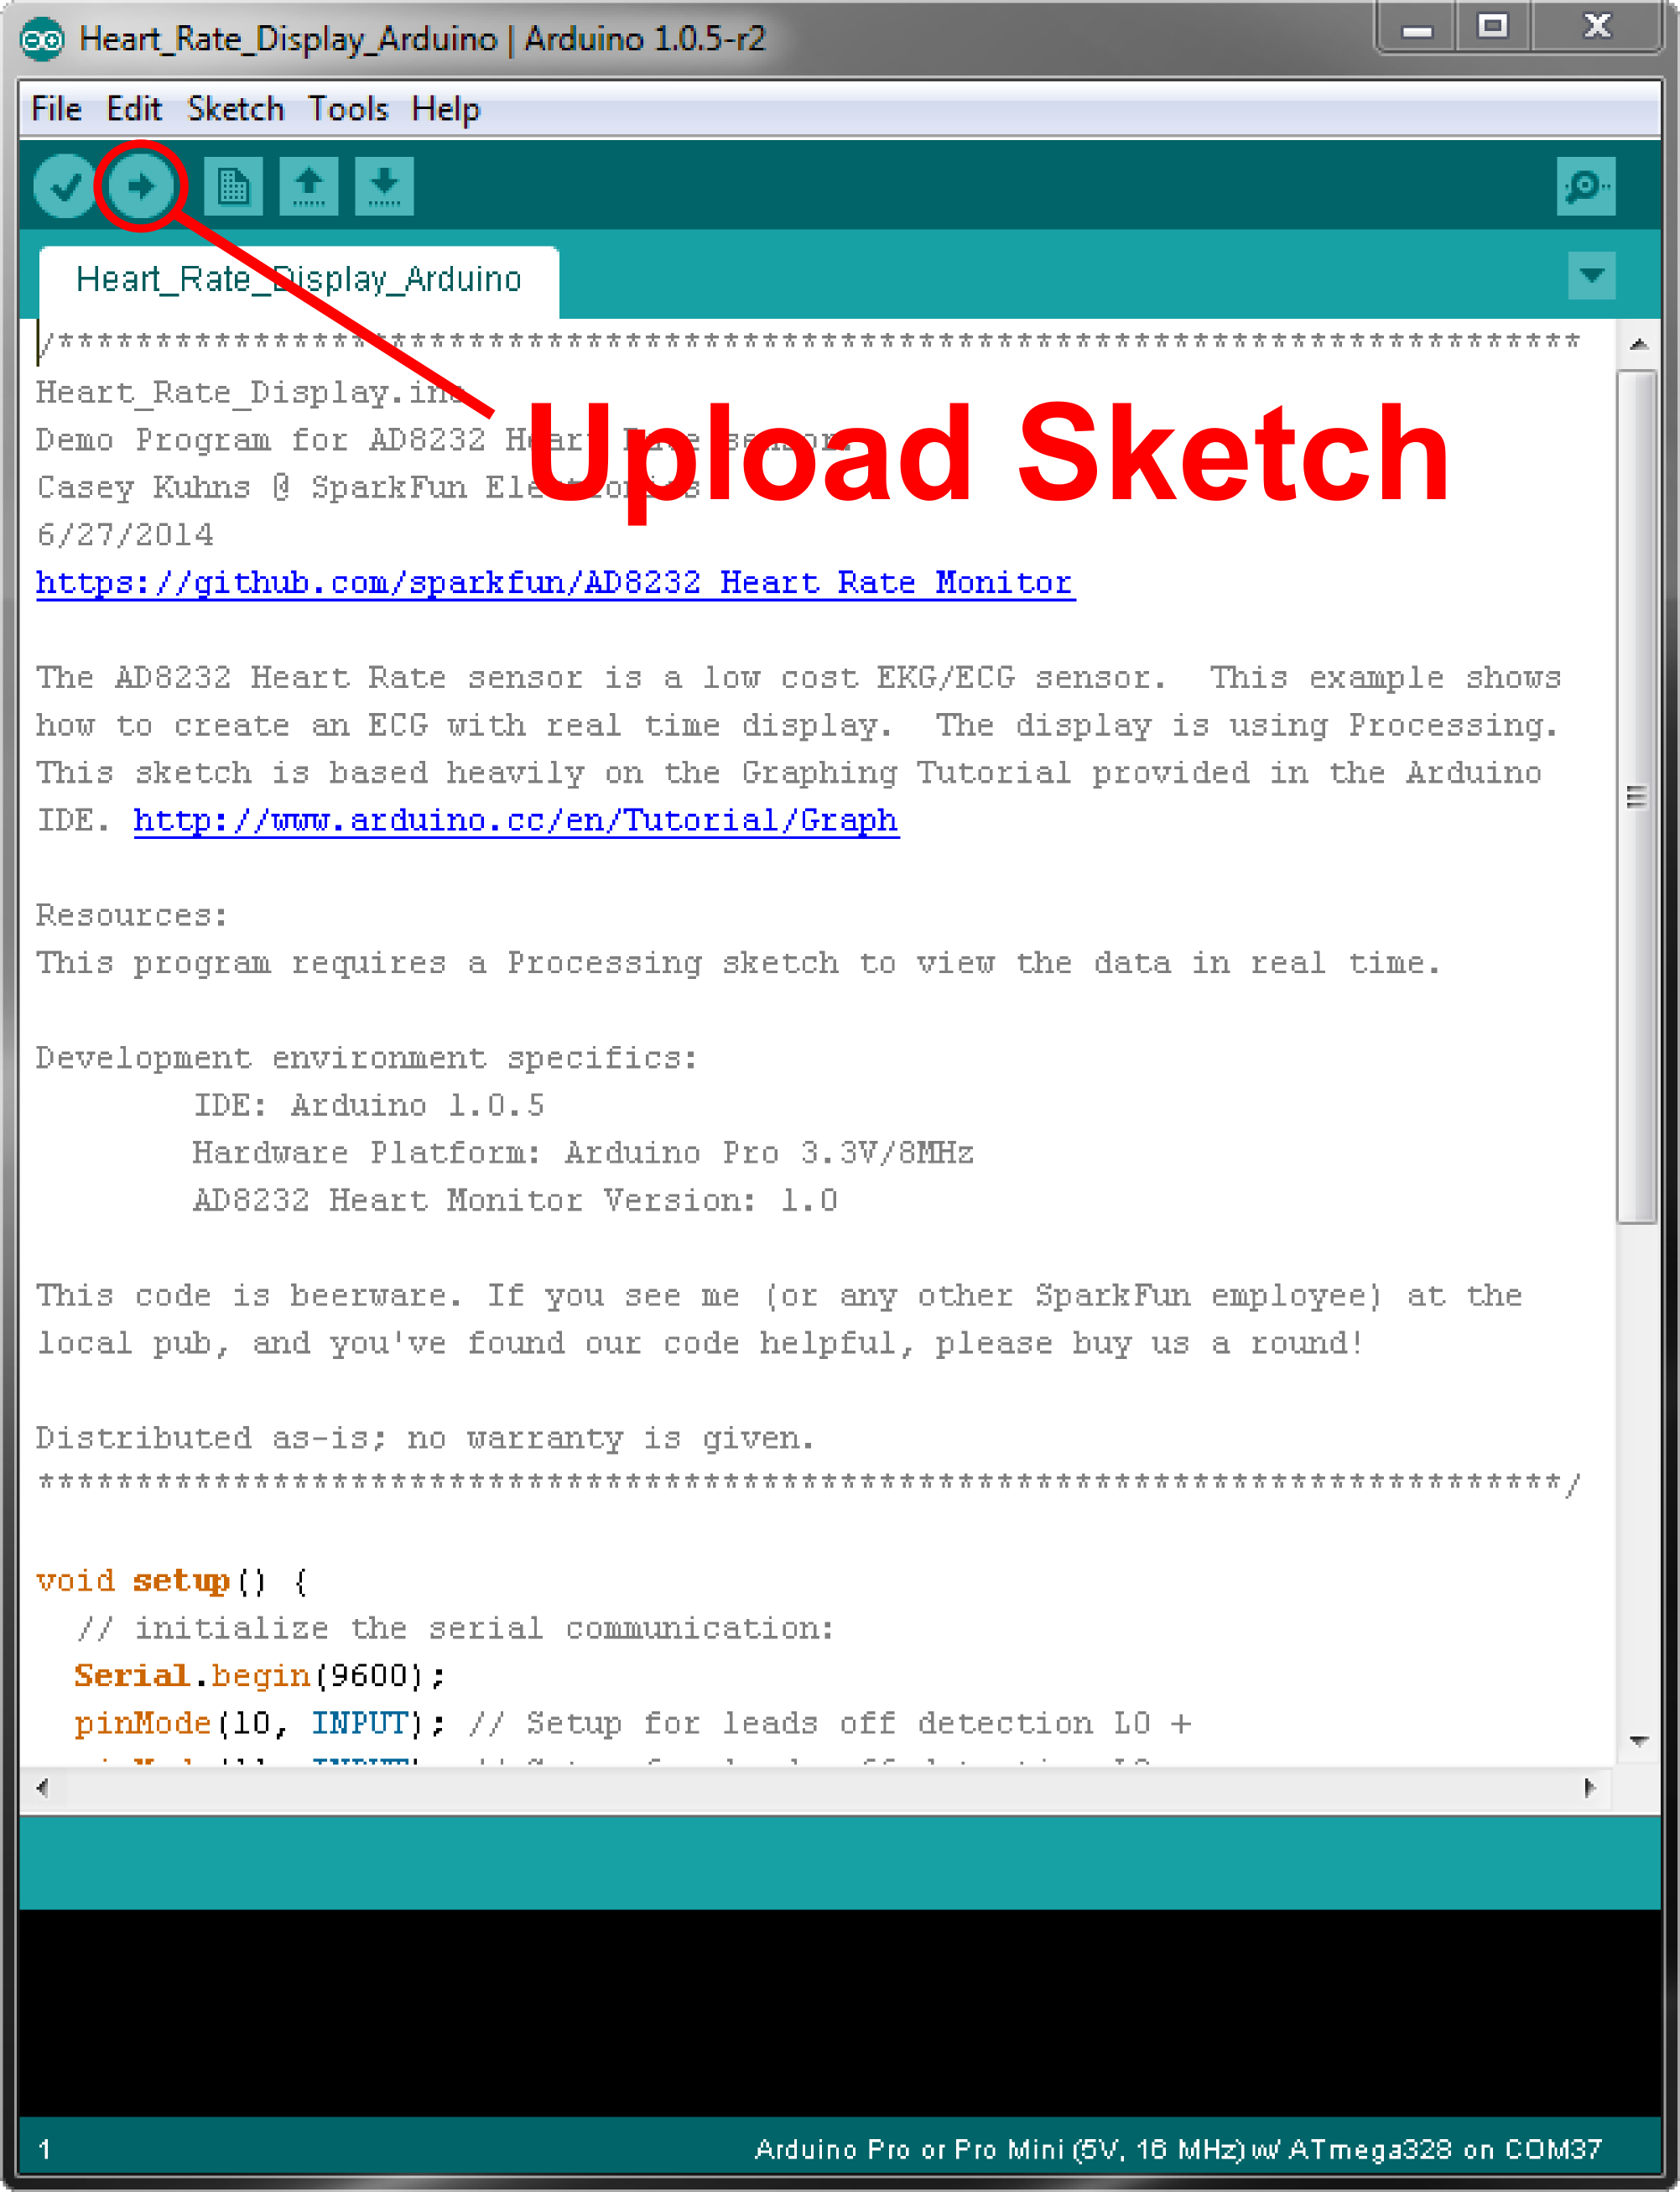
You can cut and paste the code straight from GitHub or clone the repository and open the file. Make sure to select the correct board (i.e. Arduino Pro Mini 3.3V/8MHz) and COM port. When you are ready, hit the upload button to upload the code to your board.
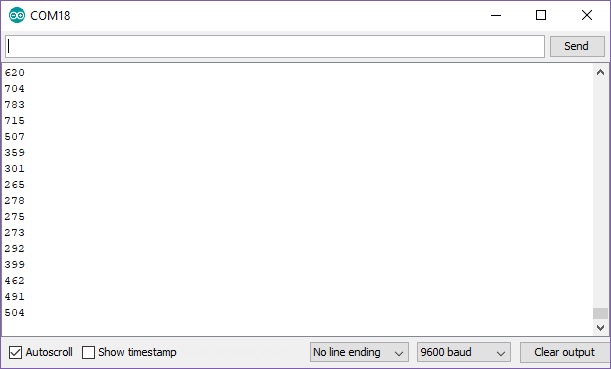
To verify that the heart rate monitor is working as expected, open the serial monitor at 9600 baud. You should see values printed on the screen. Below is an example output with the sensors connected on the forearms and right leg. Your serial output should spike between +300/-200 around the center value of about ~500.
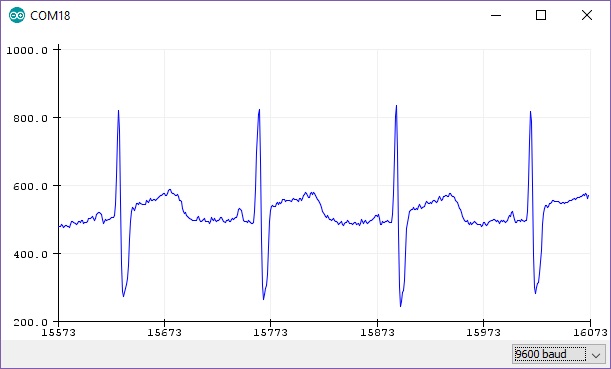
The serial data is hard to visualize if you are just viewing the values. If you are using Arduino IDE v1.6.6+, there is an option to view the data on a graph using the Arduino Serial Plotter as one option. In the Arduino IDE, select Tools > Serial Plotter. You should see a waveform similar to the image below when the sensors are placed correctly and not moving.
Processing Example
Note: Processing is a software that enables visual representation of data, among other things. If you've never dealt with Processing before, we recommend you also check out the Arduino to Processing tutorial. Follow the button below to go ahead and download and install Processing IDE v2.2.1. The following examples were intended for Processing IDE v2 so you may have issues getting it running on Processing IDE v3.
The Processing example code will give you another option to visualize the output of what's going on. The example processing sketch can be found in the GitHub repository as well.
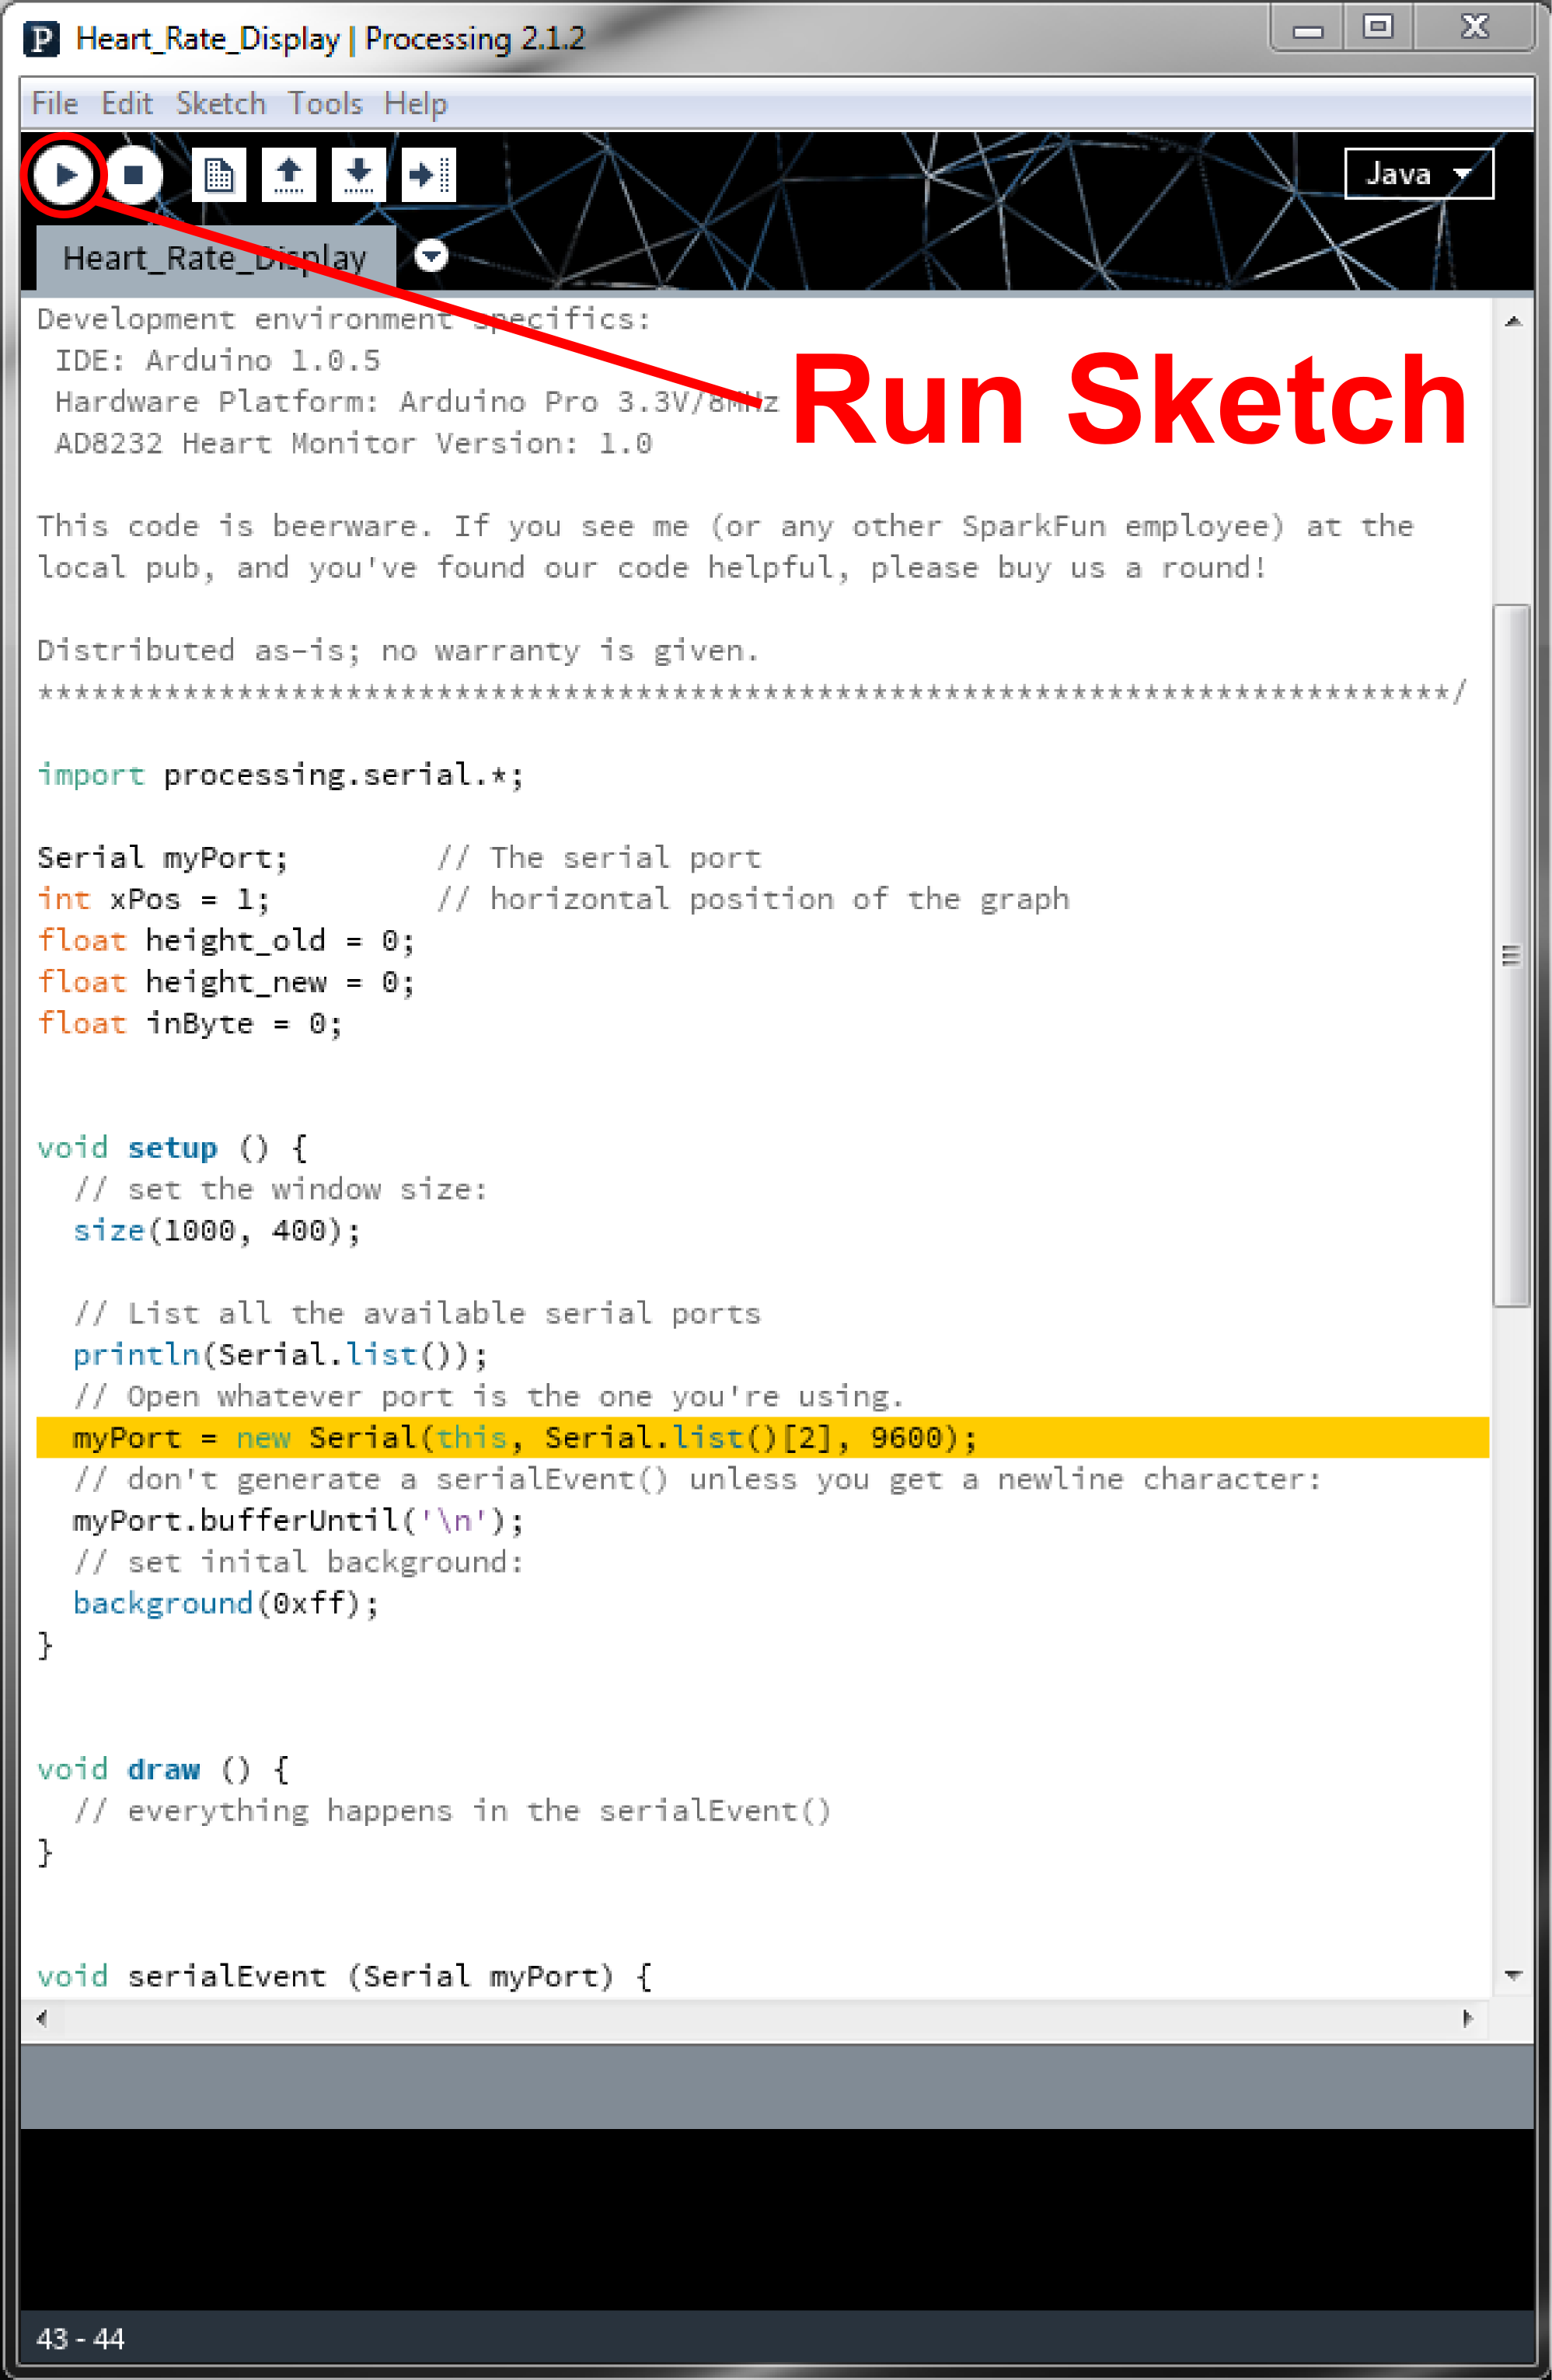
The example Processing sketch works with the Processing IDE v2.2.1. Later versions may not work with the example code so makes sure to download the stable release for v2.2.1 from the Processing IDE Download page. When ready, press the "Run" button.
The Processing sketch will probably not work at first and you will probably see nothing drawn.

If you see nothing displayed, it is probably because the Processing sketch is not reading the correct COM port. Make sure to modify the following line of code if this happens.
language:c
myPort = new Serial(this, Serial.list()[2], 9600);
You will need to change the parameter inside Serial.list()[N] based on the enumerated COM ports on your computer. A list of available COM ports will appear in the lower portion of the sketch window. Remember that COM port selection begins at 0 so you would be counting each COM port from 0 (in terms of programming not in mathematical terms) from left to right. In this case, the Arduino enumerated as COM38 when uploading so it should be in the 3rd element in the array. Therefore, you would change the value to 2. As a result, the example code would be listed as Serial.list()[2]. Typically your Arduino will appear as the highest COM number if it is the only device connected to your computer.

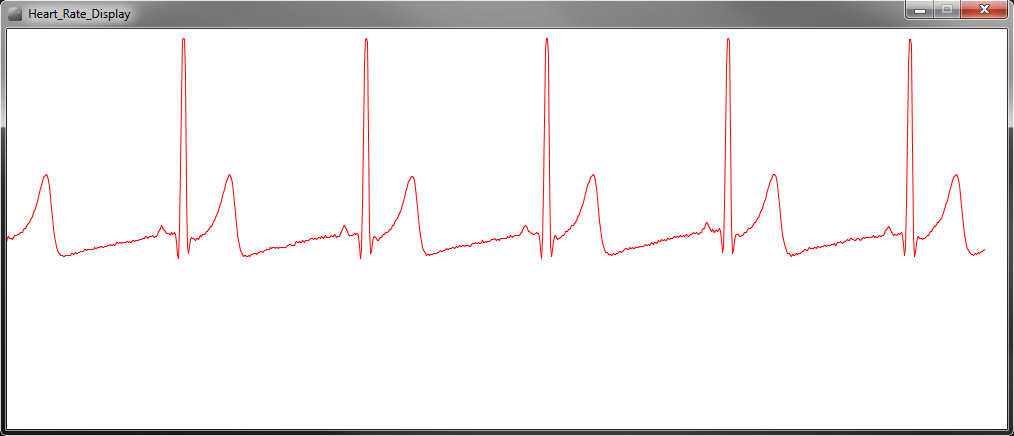
Once the COM port is adjusted with your setup, hit the Run button again. If everything is working correctly, you should see a nice box pop up and start displaying the output signal similar to the image below.
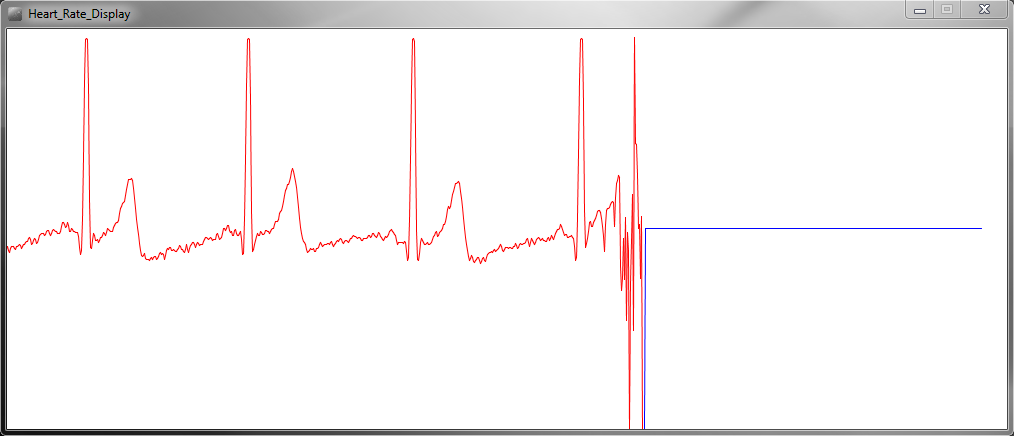
If your subject decides to remove the sensors, the leads off detection in the code will kick in and display a flat blue line.
Troubleshooting and Tips & Tricks
ECG's are notoriously noisy. This is because you are measuring muscle activation. The furtherthe sensor pads are from the heart, the more muscle noise you will see. These are commonly referred to as "Motion Artifacts". So here are some simple tips to improve the signal quality.
- Keep sensor pads as close to the heart as you can.
- Make sure the RA and LA sensor pads are on correct sides of the heart.
- Try not to move too much while taking a measurement.
- Try to use fresh pads for each measurement. The pads loose the ability to pass signals with multiple applications.
- Prep and clean the area you plan to stick pads. This will help make a good connection (hair is not a good conductor).
- You may have to adjust sensor placement for different individuals.
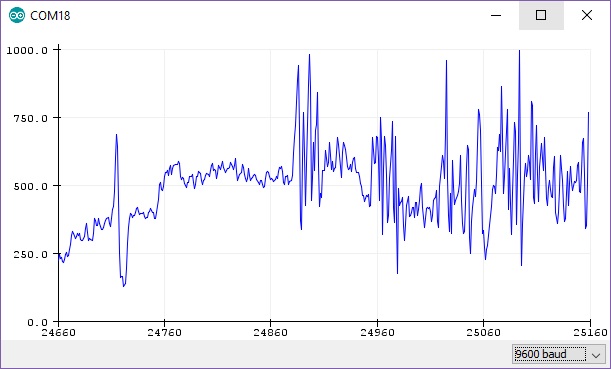
If the sensor pads are not placed correctly on the body or the cable is not connected, you may see an output similar to the image below in the serial monitor. The values will either clip the waveform between 0 and 1023 or display an "!".
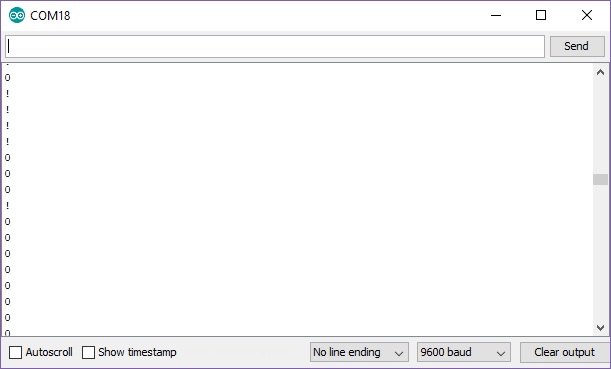
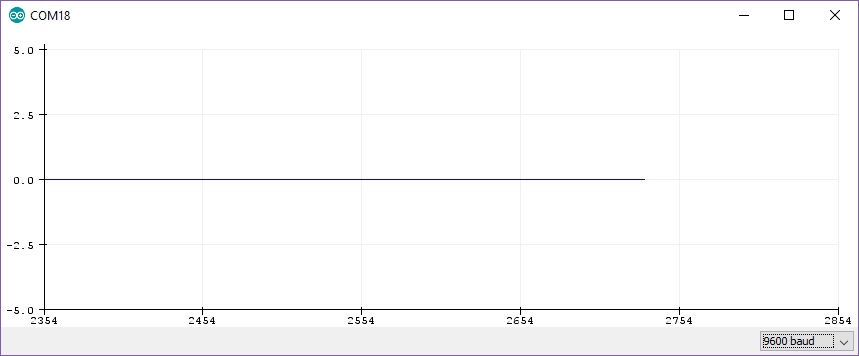
As a result, you will either see a flat line in the Arduino serial plotter or nothing will be drawn in the Processing's display window. If this happens, you'll need to check your solder joints and try placing the sensor pads to a different location around the body.
 |
|
| Arduino Serial Plotter Displaying Flat Line |
Processing Sketch Displaying Nothing |
If you happen to moving a lot or flex your muscle, you will not get a distinct waveform. Make sure to remain still and relax as the sensor is taking measurements. You may see a few distinct waveforms but it will not be as reliable.
 |
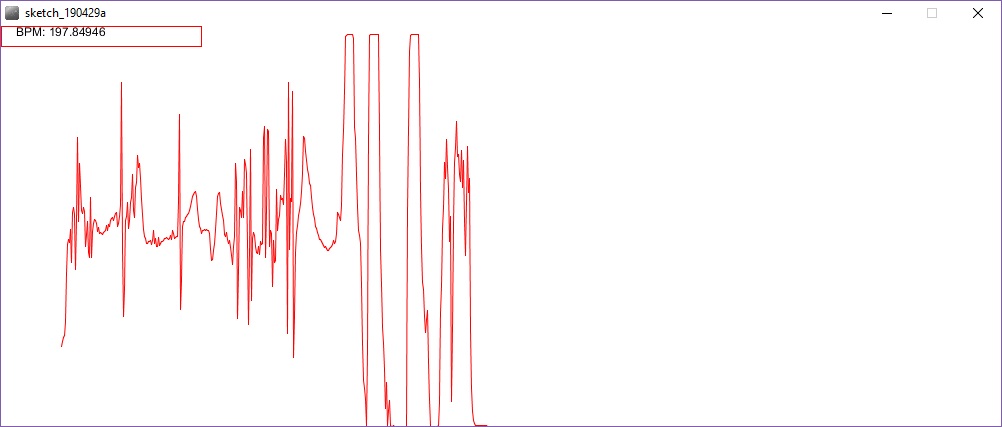 |
| Arduino Serial Plotter Displaying a Noisy Waveform |
Processing Sketch Displaying a Noisy Waveform |
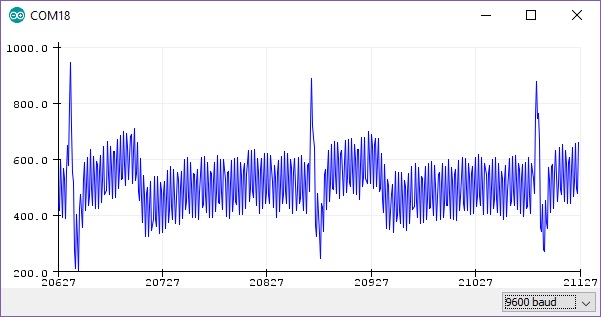
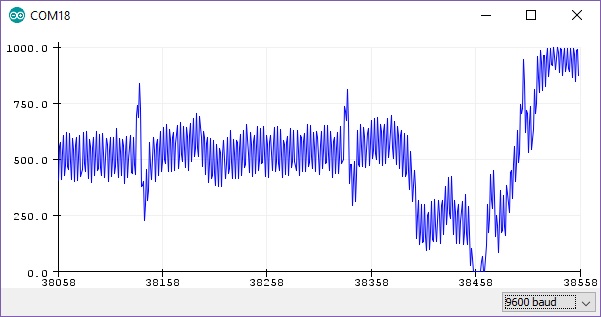
Depending on where the sensor pads are placed, you may still get a distinct waveform similar to the graphs displayed in the Arduino serial plotter below. You may notice the QT interval pulsing even though the center value is noisy. This is not as desirable as the waveforms shown earlier and the pads may need to be moved to a different location depending on your application. When inspecting the graph on the right further, you'll notice that there is a gradual spike at the end of the waveform. This was due to the sensor picking up movements from a user breathing deeply similar to when a user is moving a lot or flexing a muscle. If this happens, make sure to not force the breathing.
 |
 |
| Arduino Serial Plotter Displaying a Noisy Waveform with Distinct QT Intervals |
Arduino Serial Plotter Displaying a Noisy Waveform with Distinct QT Intervals and Motion Artifacts |
Resources and Going Further
Thanks for reading. For more resources on the AD8232 Heart Rate Monitor, check out the following links:
For more Electronics Fun, check out these other SparkFun tutorials:
Hackers in Residence - Hacking MindWave Mobile
Getting Started with Walabot
SparkFun Pulse Oximeter and Heart Rate Monitor Hookup Guide
SparkFun Photodetector (MAX30101) Hookup Guide
More Biometric products offered by SparkFun: