nRF9160 Thing Plus Hookup Guide
 Circuit Dojo, Ell C
 Programming and Debugging
There are currently two ways of programming the nRF9160 Thing Plus. You can use the built-in bootloader or use an external programmer.
Bootloader
Currently the nRF9160 Thing Plus uses the MCUBoot bootloader which comes standard with the nRF Connect SDK. It is the recommended way to load new firmware onto your nRF9160 Thing Plus.
In order to utilize the bootloader, you'll need to make sure you have newtmgr (AKA mcumgr) installed. Instructions for your platform can be found in the SDK Setup sections of this tutorial.
Pre-check: MCUBoot needs to be enabled in your project before you can use it! Make sure that you have CONFIG_BOOTLOADER_MCUBOOT=y in your prj.conf.
Put your nRF9160 Thing Plus into DFU mode.
- Press the Mode button (MD)
- While holding down the Mode button, press and release the Reset (RST) button.
- When the LED lights up, release the Mode button
Build your application if you haven't already with west build. It will create a folder called build. The file we care about is build/zephyr/app_update.bin
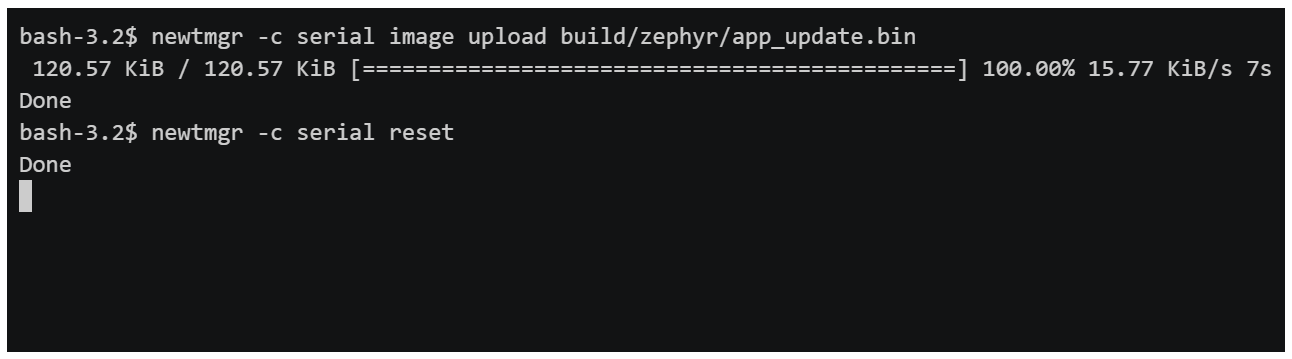
Load the file using newtmgr
- Load the binary file using: newtmgr -c serial image upload build/zephyr/app_update.bin
- Reset your board using newtmgr -c serial reset or hit the RST button. Full process below:
External Programming and Debugging
You can also use external programmers with the nRF9160 Thing Plus. Here are the current supported external programmers:
Installing programmer software
The nRF5340-DK is the programmer of choice. These steps should not be different from other J-Link supported boards.
Download your version of the nRF Command Line Tools.
- Windows
- Then, run the .exe that was downloaded. It will do all the heavy lifting for you.
- Run nrfjprog in a cmd window to make sure your install is working.
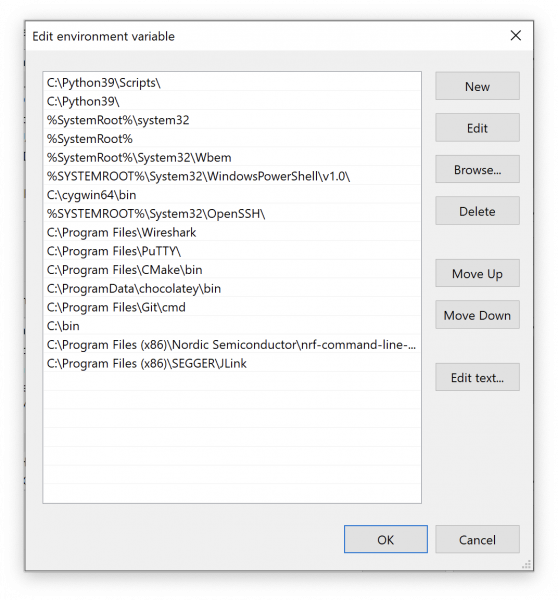
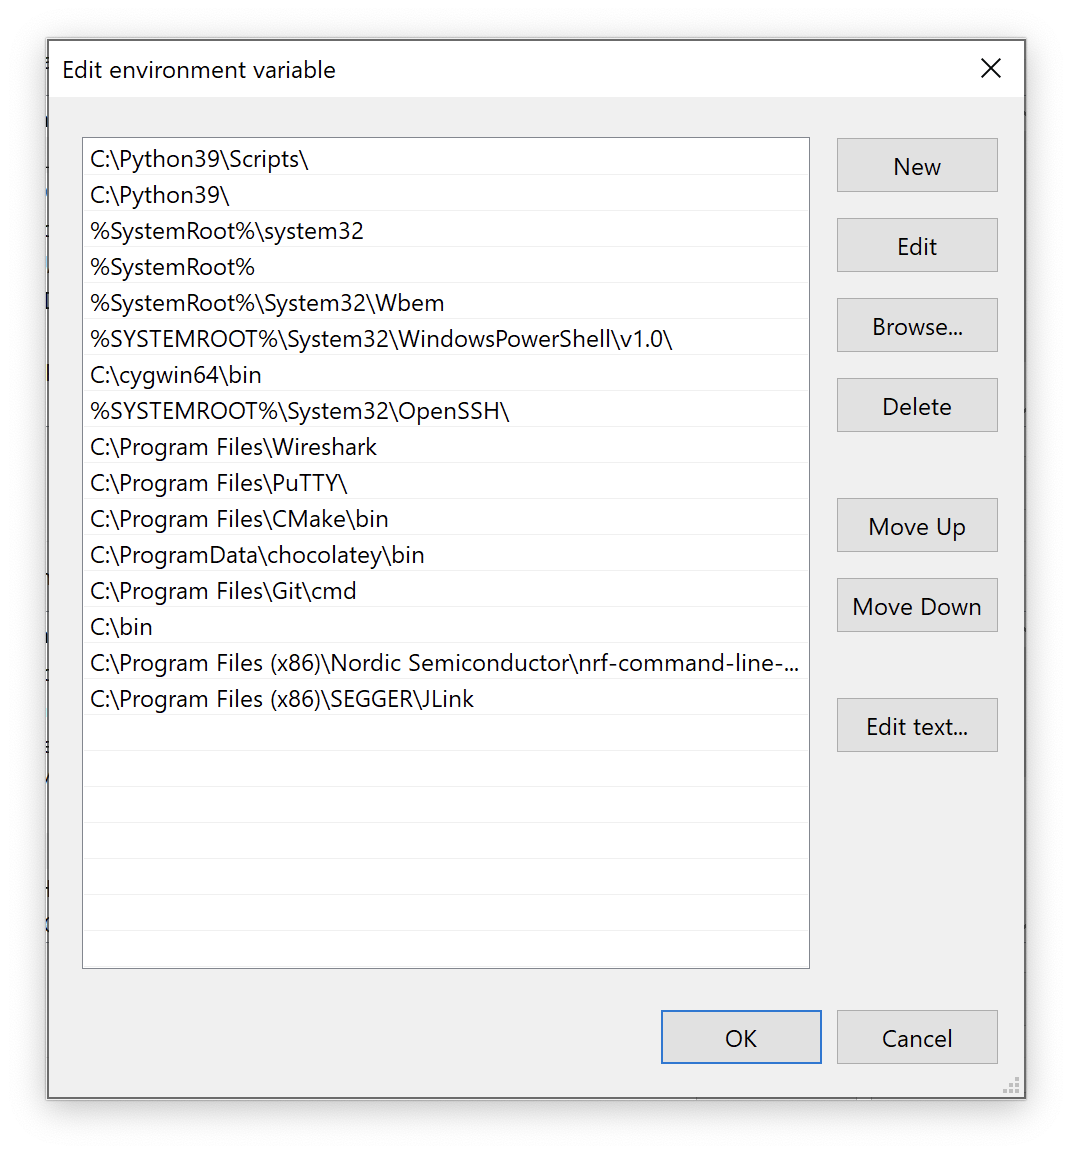
- You may also have to add JLink.exe to your path. It's the exact same procedure as adding newtmgr except the path you're adding is C:\Program Files (x86)\SEGGER\JLink.
- Close/restart VSCode and your Command Prompt
- Run jlink.exe and make sure it opens.
- Mac:
- First run nRF-Command-Line-Tools_10_9_0_OSX.pkg
- Once that install is done, run JLink_MacOSX_V680a.pkg
- Open a fresh terminal window and run nrfjprog and jlinkexe to make sure your install is complete.
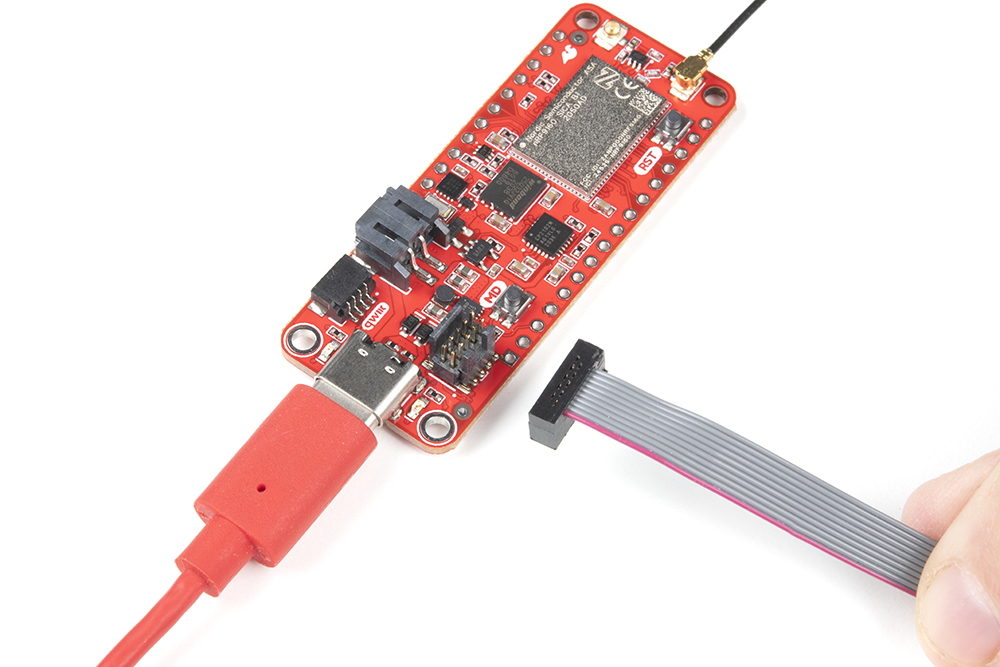
Setting up the nRF5340-DK
Here are a couple of close up shots of how to connect the nRF5340-DK:
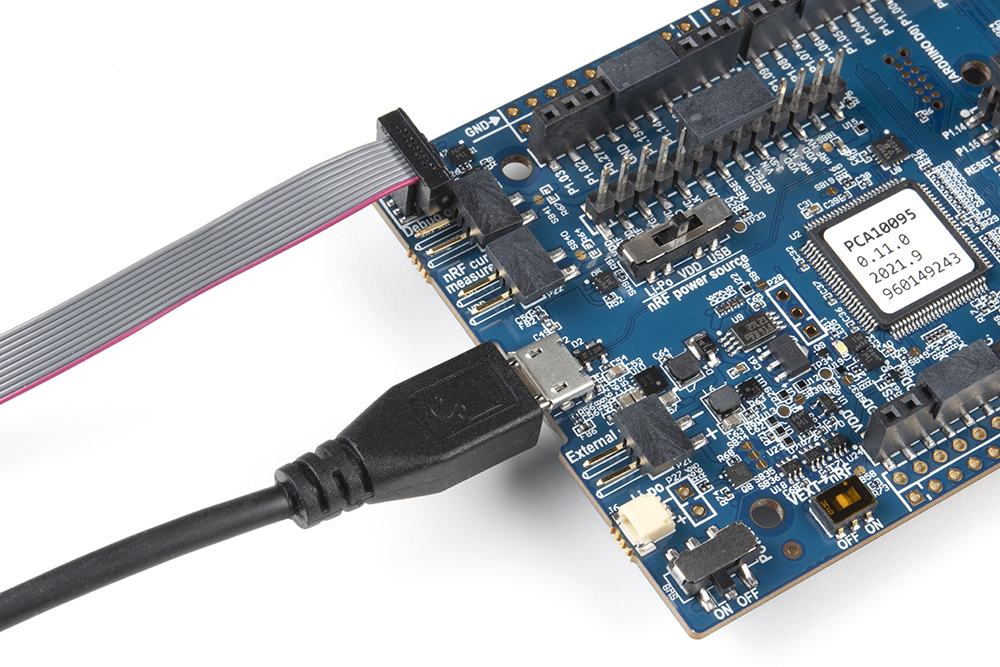

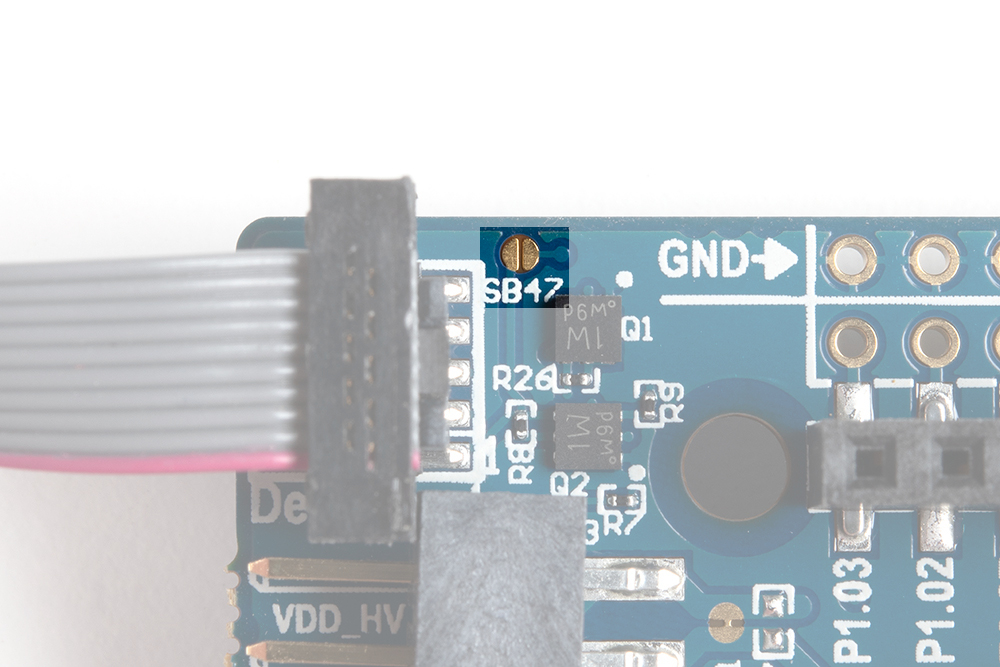
I highly recommend you jump SB47 on your nRF5340-DK with some solder. This forces the debugger to think an external devices is permanently connected. If you're only doing external debugging, this is very useful.
After hooking things up, It's time to do a quick smoke test. Running nrfjprog -r in a terminal should show this result:
language:bash
$ nrfjprog -r
Applying system reset.
Run.
Success!
Programming with the nRF5340-DK
Programming with the nRF5340-DK is straight forward in Zephyr using west. Here's what it looks like:
language:bash
west build -b circuitdojo_feather_nrf9160ns -p
west flash --runner nrfjprog
nrfjprog -r
In the above, I'm:
- Doing a pristine build of my application with the nRF9160 Thing Plus as the target.
- Then flashing using the nrfjprog runner option. This is preferred for all J-Link boards.
- Resetting the board using nrfjprog -r. As of this writing, west does not reset the board after programming.
Getting a Modem Trace
Sometimes, you may be requested to get a modem trace of your device. This section will focus on helping you get one for your nRF9160 Thing Plus.
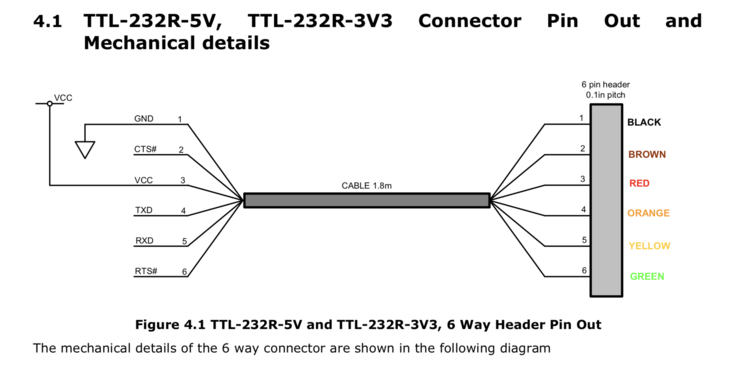
In order to get a modem trace, the TX and RX pins on your board need to be free. You'll also need a UART to USB adapter of some type. I used an FTDI one that has each of the lines broken out.
First, set your prj.conf to include the following lines:
language:bash
# Enable modem trace
CONFIG_BSD_LIBRARY_TRACE_ENABLED=y


# AT host library
CONFIG_UART_INTERRUPT_DRIVEN=y
CONFIG_AT_HOST_LIBRARY=y
Then, create a folder in your project/sample called boards and add a new file called circuitdojo_feather_nrf9160ns.overlay We'll want to enable the UART1 interface on pins 23 and 24 like below:
language:bash
/*
* Copyright (c) 2020 Circuit Dojo LLC
*
* SPDX-License-Identifier: Apache-2.0
*/

&uart1 {
status = "okay";
current-speed = <115200>;
tx-pin = <24>;
rx-pin = <23>;
};
Connect your USB to UART adapter. I've used clips from my logic analyzer to hold the wires in place. Connect the yellow wire to the TX on the board. Connect the orange wire to the RX on the board.
Then open the serial port in the modem trace app and click start.
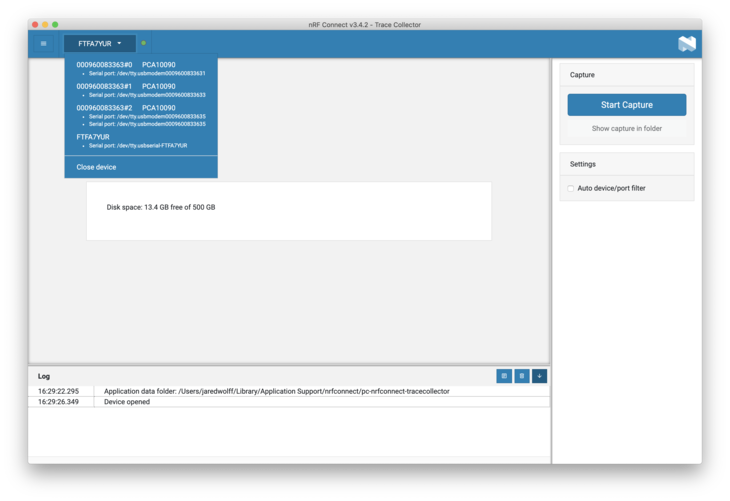
Then run your app as normal. You should see the Trace size go up little by little as connections are made, etc.
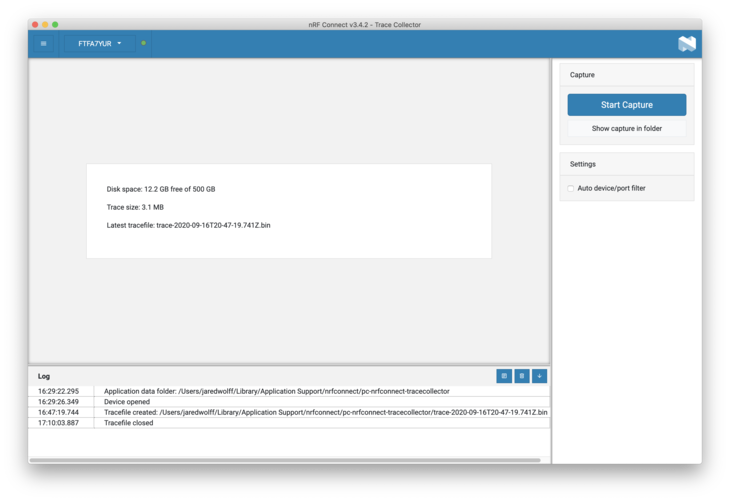
Then grab the file according to the log output. For example: Tracefile created: /Users/jaredwolff/Library/Application Support/nrfconnect/pc-nrfconnect-tracecollector/trace-2020-09-16T20-47-19.741Z.bin
For more information, check out Nordic's original article on the subject.
Debugging in Visual Studio Code
Debugging your application is possible with Visual Code. If you get a J-Link programmer such as the J-Link EDU Mini Programmer, it will include the necessary cabling. Programmers that are possible include the nRF9160 DK, nRF532 DK, J-Link EDU (if your project is non-profit) and the standard commercial J-Link programmers.
Here's the process:
Download and install your version of the nRF Command Line Tools.
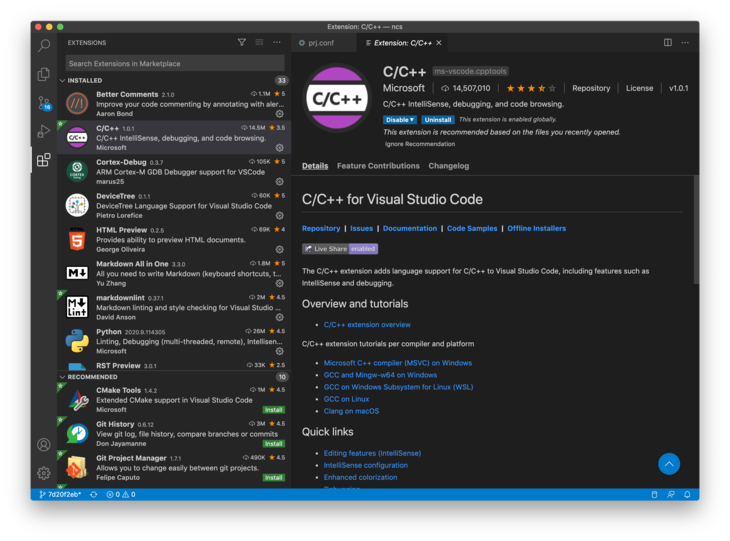
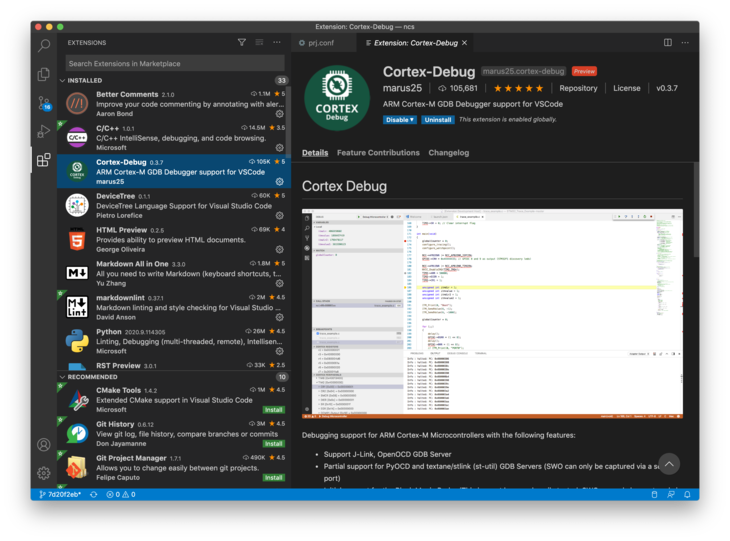
Install the C/C++ Extension and the Cortex-Debug extensions. They're both very handy in development and debugging of Zephyr based projects.
If you don't have one already, create a .vscode folder in the root of your project.
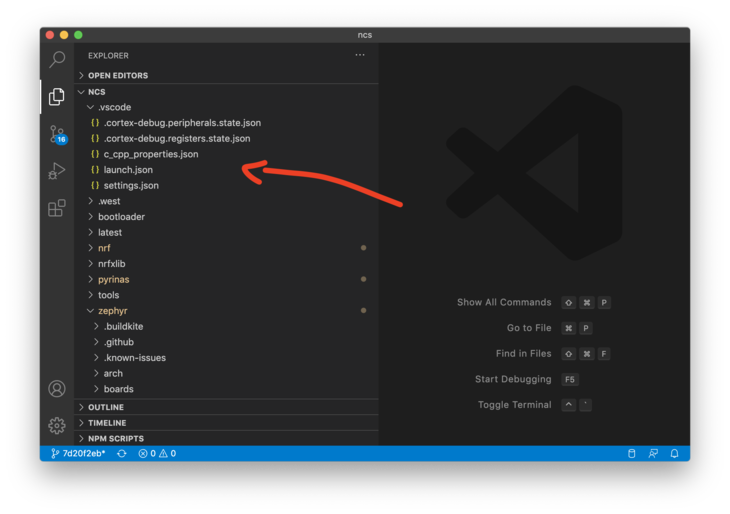
Create a file called launch.json. This is where we'll set up the configuration for debugging.
Here's a real example of a config I was using to debug a project in OSX:
{
  // Use IntelliSense to learn about possible attributes.
  // Hover to view descriptions of existing attributes.
  // For more information, visit: https://go.microsoft.com/fwlink/?linkid=830387
  "version": "0.2.0",
  "configurations": [
    {
      "name": "Cortex Debug",
      "cwd": "${workspaceRoot}",
      "executable": "${workspaceRoot}/pyrinas/applications/dreamstars/build/zephyr/zephyr.elf",
      "request": "launch",
      "type": "cortex-debug",
      "servertype": "jlink",
      "device": "nrf9160_xxAA",
      "interface": "swd",
      "armToolchainPath": "/Users/jaredwolff/gcc-arm-none-eabi-9-2019-q4-major/bin"
    }
  ]
}
For folks on Windows you'll have to modify appropriately:
{
 // Use IntelliSense to learn about possible attributes.
 // Hover to view descriptions of existing attributes.
 // For more information, visit: https://go.microsoft.com/fwlink/?linkid=830387
 "version": "0.2.0",
 "configurations": [
    {
        "name": "Cortex Debug",
        "cwd": "${workspaceRoot}",
        "executable": "${workspaceRoot}\\nrf9160-feather\\samples\\blinky\\build\\zephyr\\zephyr.elf",
        "request": "launch",
        "type": "cortex-debug",
        "servertype": "jlink",
        "device": "nrf9160_xxAA",
        "interface": "swd",
        "armToolchainPath": "C:\\Program Files (x86)\\GNU Tools Arm Embedded\\9 2019-q4-major\\bin"
    }
 ]
}
Remember that workspaceRoot refers to the folder you have opened in VSCode. This will most likely be /opt/nordic/ncs/v1.4.1/nfed or c:\users\<user name>\ncs\v1.4.1\nfed. You will have to modify the "executable" entry to match the path of your zephyr.elf file.
Change the executable path and the armToolchainPath to reflect your system. Make sure you point the executable option to the .elf file that gets produced during the compilation process.
Next, go to your projects prj.conf and disable the bootloader by commenting out CONFIG_BOOTLOADER_MCUBOOT=y or changing the y to a n. As of this writing, disabling the bootloader is required as it prevents the debugging process from occuring.
In prj.conf you'll also want to enable the CONFIG_DEBUG option. This disables compiler optimizations which make the debug process hairy and/or impossible.
Finally, program your project using west build && west flash.
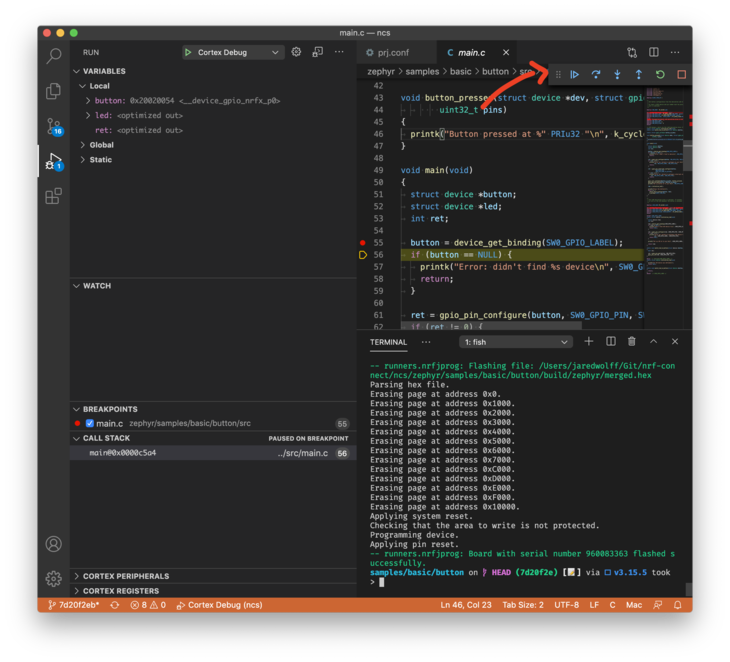
At this point, if you've ever done any debugging in Visual Code, you should be able to follow the final steps to debug your application!
Set some breakpoints in your code by pressing the line number you want. A red dot will appear where the breakpoint is set.
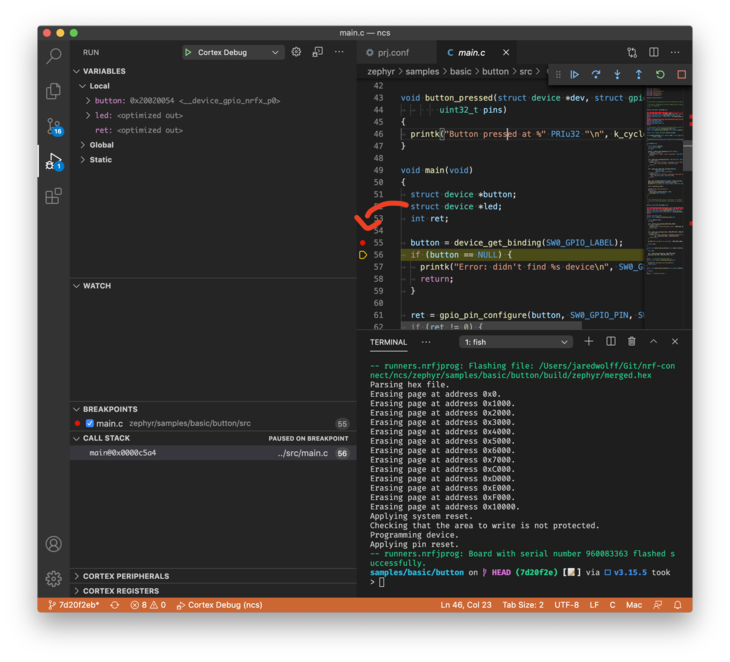
Start debugging by clicking the debug icon on the left. Then click the play button in the top left.
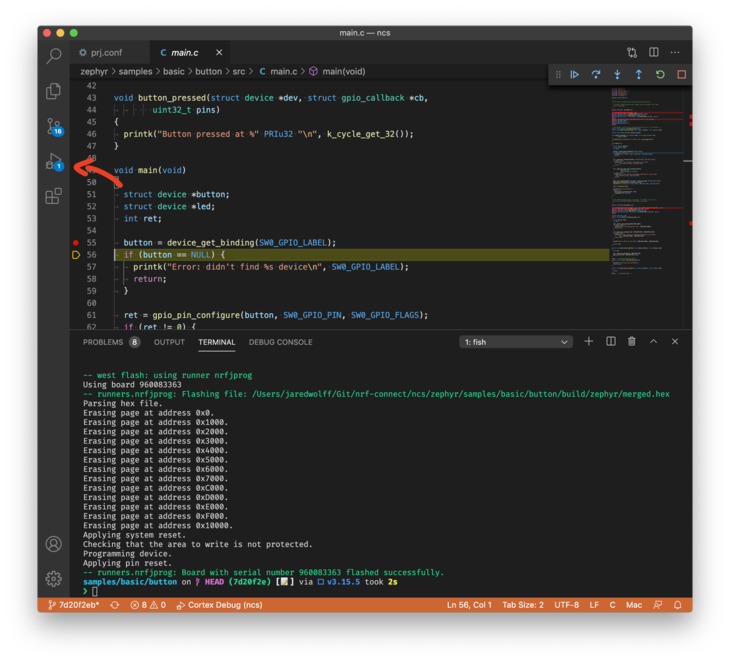

You can use the popup menu on the right to control traversal through your code.