SparkFun Photodetector (MAX30101) Hookup Guide
Arduino Examples
☠ Do not rely on our examples for medical diagnosis or any life saving applications
Note: Particle detection, heart rate measurement, and photoplethysmography (for pulse oximetry) are applications of the MAX30101. These applications require a fundamental understanding of the operating principles of the sensor and a conceptual knowledge of the applications. Although, we provide some examples for these applications; they are primarily for demonstration purposes only and are not supported by SparkFun.
Note: Although there is an example, Maxim has since removed the proximity sensing and particle detection as functionalities of this sensor in their datasheet.
Example 1 - Reading Red/IR/Green
Once you've got the library installed, open the Example1 Basic Readings sketch. You can find it under
File > Examples > SparkFun MAX3010x Pulse and Proximity Sensor Library > Examples
Then load it onto your RedBoard or Uno. Open your favorite Serial Terminal to see the printed values.
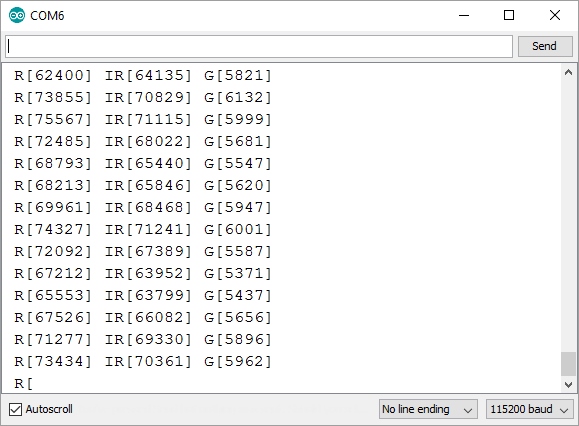
This example outputs the raw values read by the sensor. With the sensor pointing up, use your hand to hover over the sensor. You should see a change in values as your hand reflects different amounts of light. Note that the IR readings will probably change before the Red and Green readings. IR is better at sensing distance changes.
Completely cover the sensor with your finger. Note the very large readings. This is one of the features that sets the MAX30101 from other reflectance sensors. The IC is capable of reading up to 18-bits or values up to 262,144. An extremely small change in light can be detected!
The MAX30101 is easy to use! Calling particleSensor.getGreen() will take a reading and return the reflected amount of green light.
Example 3 - Temperature Sensor
Open the Example3 Temperature Sense sketch, and load it onto your RedBoard or Uno.

This example outputs readings from the on-board temperature sensor in both Celsius and Fahrenheit. The temp sensor is accurate to ±1 °C but has an astonishing precision of 0.0625 °C.
The temperature is used internally by the sensor to calibrate its samples but can be useful if you need a sensitive and fast responding temp sensor.
Example 4 - Heart Beat Plotting
For this demo, you'll need a rubber band small enough to go through the mounting holes on the breakout. Make sure to follow the example in the Hardware Assembly section for the best results.
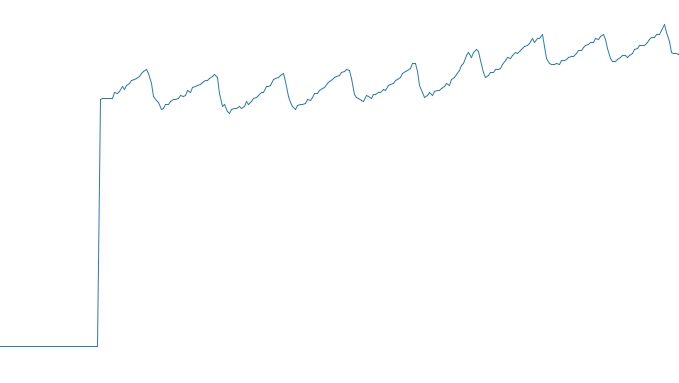
This is where the fun really begins! Hemoglobin reflects IR light really well, and the MAX30101 is capable of detecting such small changes in IR reflectance that it can detect blood flowing through your finger at different rates. Let's graph it! Open the Example4 HeartBeat Plotter sketch, and load it on your Redboard or Uno.
Instructions:
- Load code onto Redboard
- Attach sensor to your finger with a rubber band
- Open Tools->Serial Plotter
- Make sure the drop down is set to 115200 baud
- Checkout the blips!
- Feel the pulse on your neck and watch it mimic the blips
Humans are bad at applying consistent pressure to a thing. Without a rubber band the pressure varies enough to cause the blood in your finger to flow differently which causes the sensor readings to go wonky. It is best to attach the sensor to your finger using a rubber band or other tightening device.
Now that we have seen the blips, Example 5 will try to calculate the time between blips and show us beats per minute (BPM).
Example 5 - HeartRate
Open the Example5 HeartRate sketch, and load it on your Redboard or Uno.
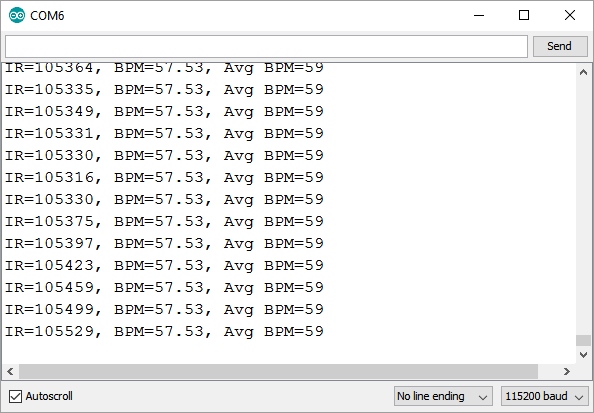
This example runs a filter called the PBA or Penpheral Beat Amplitude algorithm on the IR data. This algorithm is able to pull out the blips from all the noise and calculate the time between blips to get a heart rate. The output is your instantaneous heart rate and your average heart rate (BPM).
As one might expect the human body isn't as precise as a metronome. The time between pulses can vary quite a bit so this sketch takes a running average of 4 readings to try to smooth out the variance.