Qwiic Kit for Raspberry Pi V2 Hookup Guide
Let's Run the Code Already!
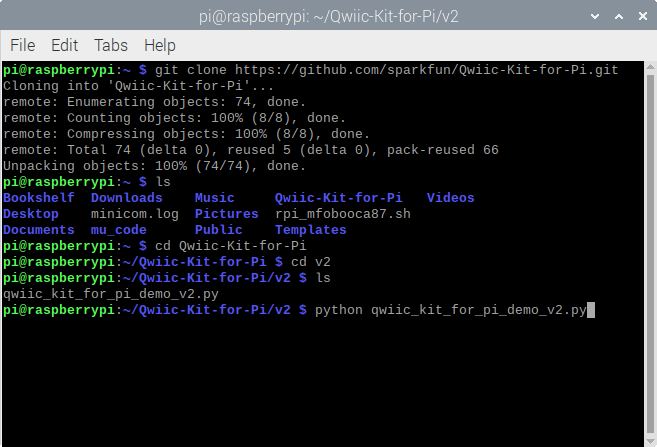
OK, now that we've updated our code to submit data to our Cayenne account and figured out which variables we want to send where we can run the code. Make sure you save your code (with your Cayenne account information and any other changes you wanted to make). Then open a terminal window and navigate to the folder where your code is if you have not already. Type the following command and ENTER to run the script. Our code actually runs a loop until we decide to cancel the program CTRL + C.
language:bash
python qwiic_kit_for_pi_demo.py
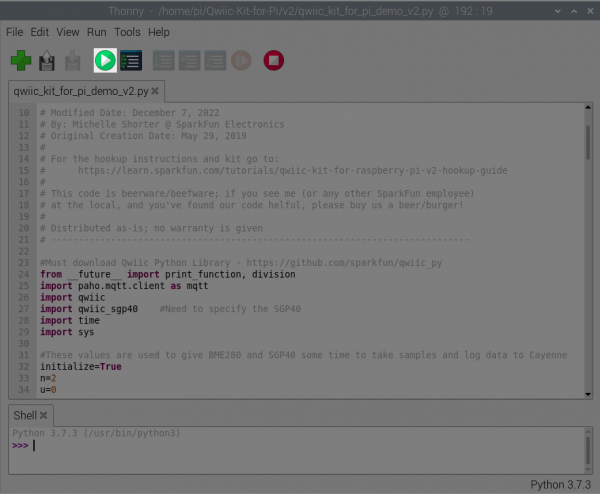
Or hit the Run button in your Python editor to start executing the script. To stop, simply click on the Stop button with your mouse.
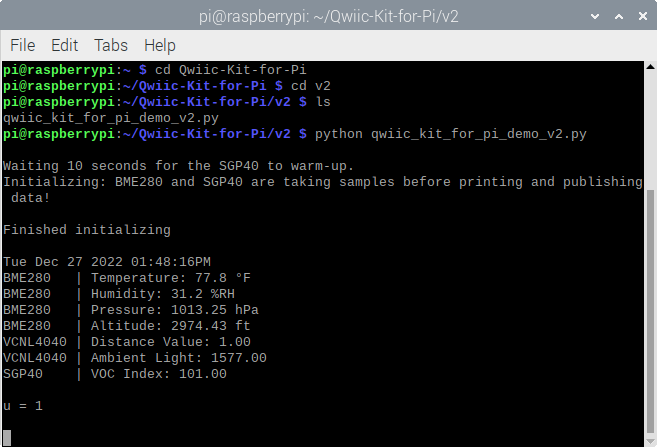
Assuming you don't get any errors you should see some of the sensor data displayed on your screen.
 |
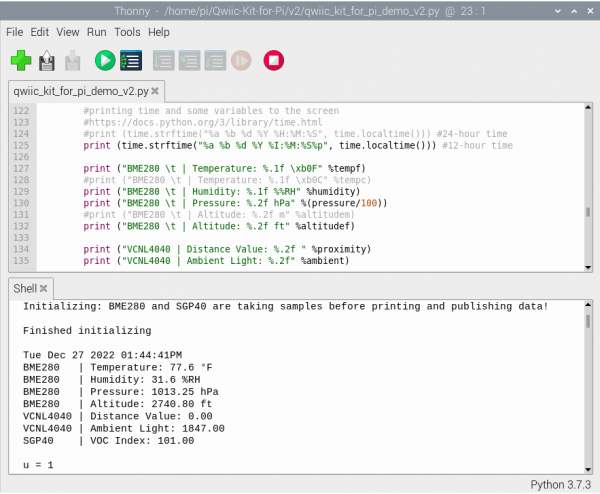 |
| Running Demo via Command Line | Running Demo via Thonny Editor |
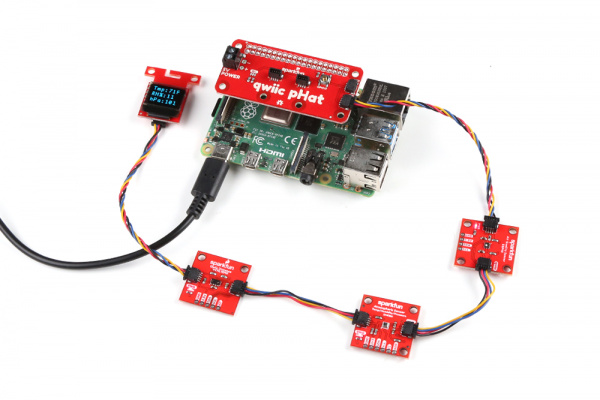
If you look at the microOLED, you will also notice some of the BME280 sensor data on the display.
Tue Dec 20 2022 03:49:31PM
BME280   | Temperature: 76.2 °F
BME280   | Humidity: 12.3 %RH
BME280   | Pressure: 1013.25 hPa
BME280   | Altitude: -5256.14 ft
VCNL4040 | Distance Value: 1.00
VCNL4040 | Ambient Light: 602.00
SGP40 | VOC Index: 96.00The SGP40 will take longer for the sensor values to stabilize. For the best results, let the SGP40 run for 24hrs to generate a "history" of the average VOC gas concentration in the room. For more information on the SGP40, check out the SGP40 datasheet, Sensirion VOC Index for Experts, Sensirion SGP40 Design In Guide, and SGP40 Quick Testing Guide.
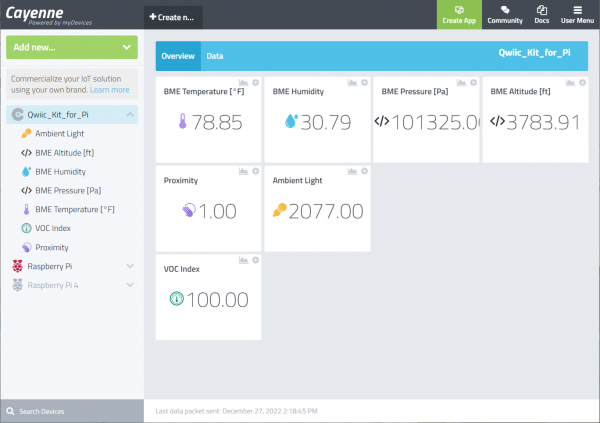
You will also start seeing the green boxes popping up on Cayenne as well so you can add them to your dashboard and move them around.
Congratulations, you now know how to read Qwiic sensors on a Pi, display data to your Pi, display data on the Qwiic micro OLED screen, and get that information to display on the web. Try adjusting the code to send data to the web at a slower rate or calibrate the sensor readings for stable readings. Keep checking the Qwiic_Py repo for more Python libraries for our Qwiic boards or write your own and start experimenting.
