Monitor Sensor Data from Anywhere
Contributors:
 ROB-24601, Mariah
ROB-24601, Mariah 
Step 3: Fine Tuning Your Dashboard
One of the reasons I went with KaaIoT for this build was the wide variety of pre-existing widgets available to display your information. Here, we'll set up a dashboard to read your incoming data in an easy-to-read and visually interesting way!
- If you go to the left side of your screen and click on Solutions, it will bring up a screen with all of your projects on it, although at this point you should only have one. Select your solution.
- You should then be on a screen that contains all of your dashboards for the current project. (Again, at this point, you will have only a single dashboard, named “Home”). Select that dashboard.
- That will bring you to your primary dashboard, which you’ll notice is currently empty. Click on the large "Add Widget" button on the left of the screen and start with a widget to display our temperature.
- Choose one of the Gauges widgets. I went with a Vertical Bold gauge.
- You can edit this widget in the upper right hand corner by clicking on Edit. This will allow us to insert the proper information, data, and look that we want. I’ve listed the values I used for everything in the table below. Some, like the Application Name and Endpoint ID, will need to be specific. Most of them, however, are open to allow you to tweak your display however you want.
| EDIT WIDGET | |
|---|---|
| Widget Decoration | |
| Title | Temperature |
| Display Header | X |
| Use Transparent Backgound | |
| Display Icon | |
| Z Index | |
| Easy Load | |
| Hide Based on Condition | |
| Data Source | |
| Service Instance Name** | epts |
| Application** | Your named Application |
| Endpoint ID** | Your Endpoint ID |
| Time Series** | auto-temperature |
| Time Series Value** | values.value |
| Reference Timestamp | Latest |
| Update Interval | 1 seconds |
| Variables | |
| Appearance | |
| Gauge Type | Verticle Bold |
| Precision | 2 |
| Postfix | F |
| Gauge Scale | |
| Lower Boundary | 0 |
| Upper Boundary | 100 |
| Step | 10 |
| Color Coding | |
| Base Color | Red |
| Thresholds | |
| ABC <= | 20 / Violet |
| ABC <= | 40 / Blue |
| ABC <= | 60 / Green |
| ABC <= | 80 / Lemon |
| ABC <= | 100 / Red |
** These fields are pretty set, but feel free to get creative with the rest of them
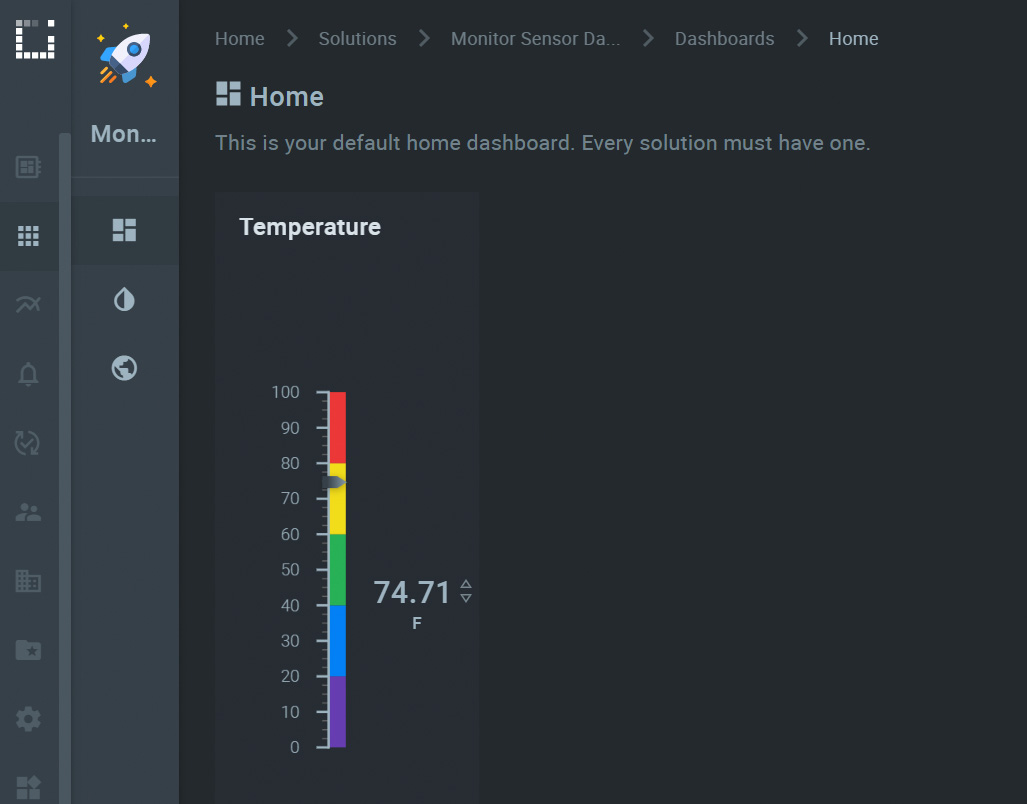
Here's an example of how a temperature widget can look
Once you’ve got your widgets looking the way you want, you can finalize them by clicking on the “Publish Changes” button on the upper right corner of your screen. Clicking on Edit Mode (or the Lock Slider next to it) locks down your dashboard. You can now see your data from anywhere in the world you can connect to the web. I also pulled up the KaaIoT website on my phone, and found it completely viewable and workable that way as well, even allowing me to easily edit my widgets!