Python Programming Tutorial: Getting Started with the Raspberry Pi
 Shawn Hymel
 Experiment 5: File Reading and Writing
Let's take our previous example (taking measurements from an I2C device) and log them to a file! This can be incredibly useful if you are trying to measure the temperature (light, humidity, wind speed, air pressure, people entering your room, or really anything) and want to see how it changes over the course of minutes, hours, or days.
Recommended Reading
- A Byte of Python: File I/O - See how to read and write to files
- Python Docs: Reading and Writing Files - Another look at how file input/output works
Hardware Connections
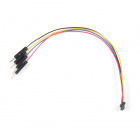
Qwiic Cable - Breadboard Jumper (4-pin)
PRT-14425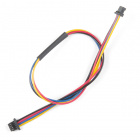
Qwiic Cable - 200mm
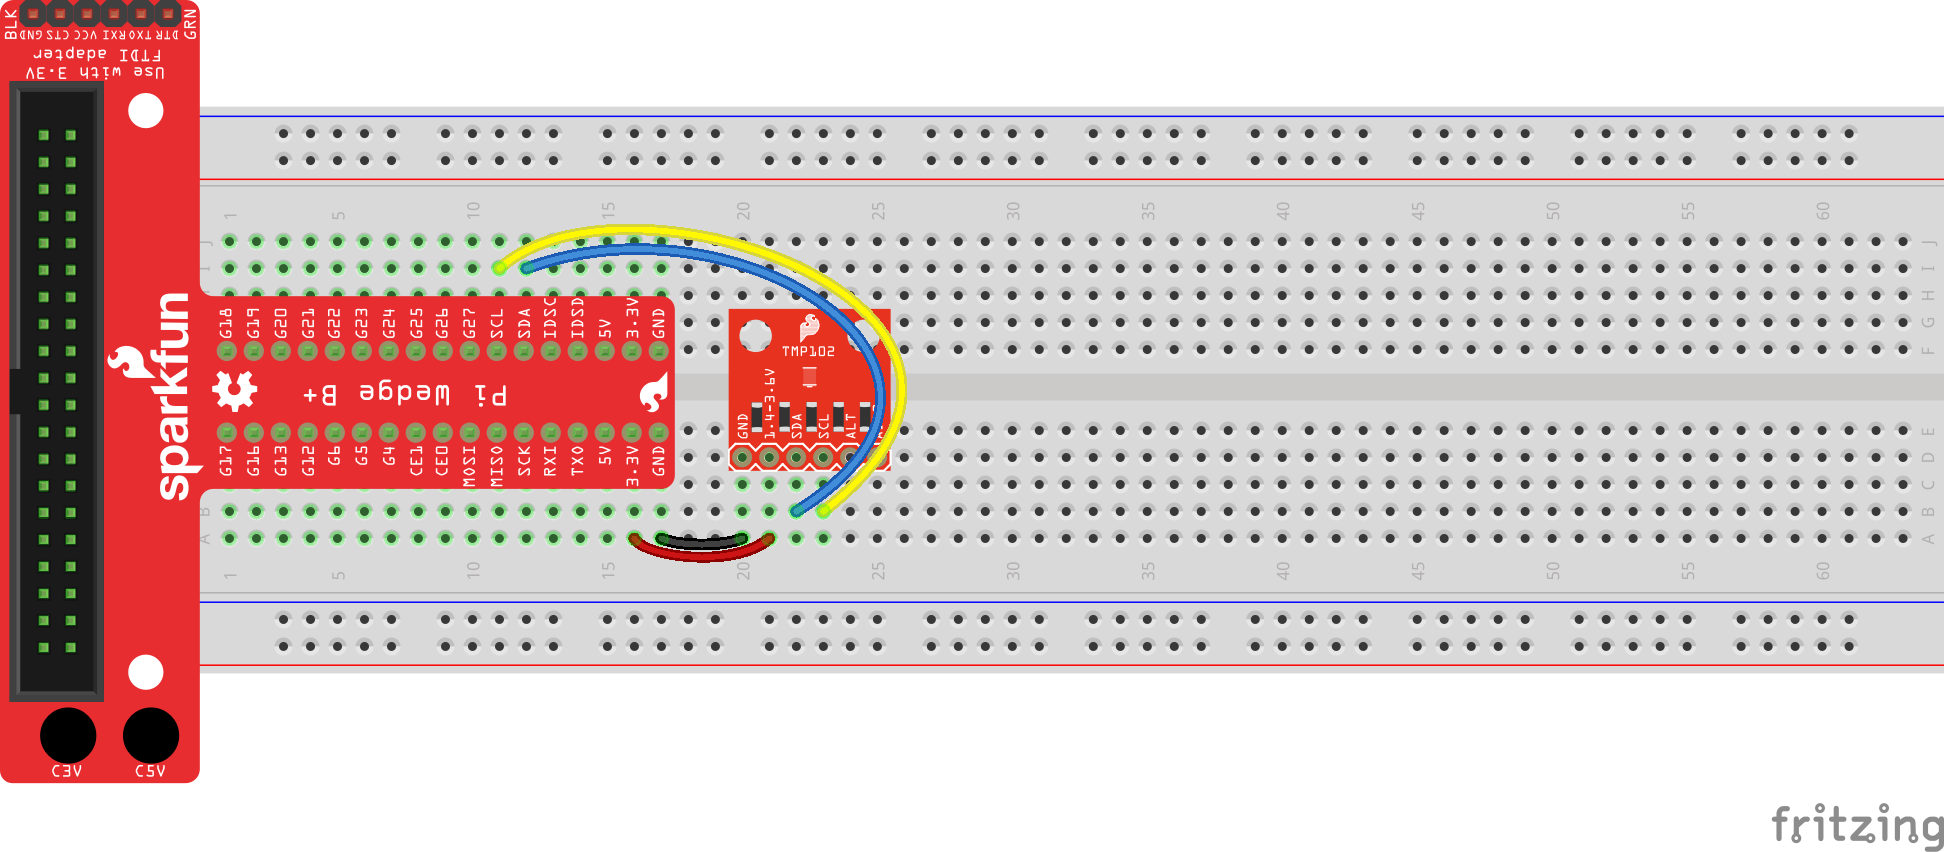
PRT-14428We'll use the same circuit as last time.
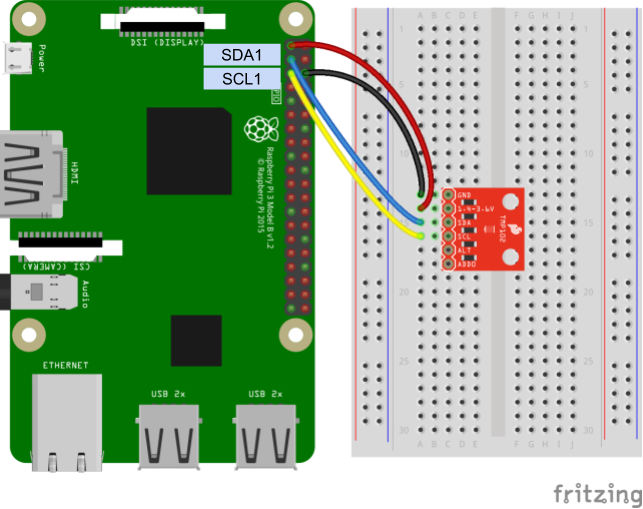
- Connect SDA1 (GPIO2, pin 3) to SDA on the TMP102
- Connect SCL1 (GPIO3, pin 5) to SCL on the TMP102
- Connect power (3.3 V) to VCC on the TMP102
- Connect ground (GND) to GND on the TMP102
Connecting through a Pi Wedge:
Connecting directly to the Raspberry Pi:
Code: Measure and Log Temperature to a File
We'll turn our previous code into a module for use to use. Change the code in tmp102.py to the following:
tmp102.py
language:python
import smbus

# Module variables
i2c_ch = 1
bus = None

# TMP102 address on the I2C bus
i2c_address = 0x48

# Register addresses
reg_temp = 0x00
reg_config = 0x01

# Calculate the 2's complement of a number
def twos_comp(val, bits):
    if (val & (1 << (bits - 1))) != 0:
        val = val - (1 << bits)
    return val

# Read temperature registers and calculate Celsius
def read_temp():

    global bus

    # Read temperature registers
    val = bus.read_i2c_block_data(i2c_address, reg_temp, 2)
    # NOTE: val[0] = MSB byte 1, val [1] = LSB byte 2
    #print ("!shifted val[0] = ", bin(val[0]), "val[1] = ", bin(val[1]))

    temp_c = (val[0] << 4) | (val[1] >> 4)
    #print (" shifted val[0] = ", bin(val[0] << 4), "val[1] = ", bin(val[1] >> 4))
    #print (bin(temp_c))

    # Convert to 2s complement (temperatures can be negative)
    temp_c = twos_comp(temp_c, 12)

    # Convert registers value to temperature (C)
    temp_c = temp_c * 0.0625

    return temp_c

# Initialize communications with the TMP102
def init():

    global bus

    # Initialize I2C (SMBus)
    bus = smbus.SMBus(i2c_ch)

    # Read the CONFIG register (2 bytes)
    val = bus.read_i2c_block_data(i2c_address, reg_config, 2)

    # Set to 4 Hz sampling (CR1, CR0 = 0b10)
    val[1] = val[1] & 0b00111111
    val[1] = val[1] | (0b10 << 6)

    # Write 4 Hz sampling back to CONFIG
    bus.write_i2c_block_data(i2c_address, reg_config, val)

    # Read CONFIG to verify that we changed it
    val = bus.read_i2c_block_data(i2c_address, reg_config, 2)
Create a new file and enter the following code. Give the file a name such as templogger.py.
templogger.py
language:python
import time
import datetime
import tmp102

filename = "temp_log.csv"

# Create header row in new CSV file
csv = open(filename, 'w')
csv.write("Timestamp,Temperature\n")
csv.close

# Initialize communication with TMP102
tmp102.init()

# Sample temperature every second for 10 seconds
for t in range(0, 10):

    # Construct CSV entry from timestamp and temperature
    temp_c = str(round(tmp102.read_temp(), 2))
    entry = str(datetime.datetime.now())
    entry = entry + "," + temp_c + "\n"

    # Log (append) entry into file
    csv = open(filename, 'a')
    try:
        csv.write(entry)
    finally:
        csv.close()

    # Wait 1 second before sampling temperature again
    time.sleep(1)

# When all the writing has been completed, print the CSV contents
csv = open(filename, 'r')
print(csv.read())
csv.close()
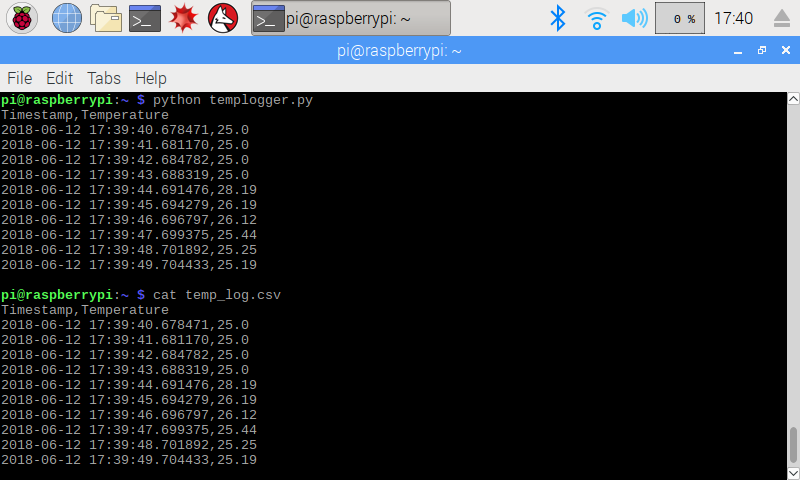
Run the temperature logger with python templogger.py. You should see nothing happen for 10 seconds as the program reads the temperature once every second. For fun, try breathing on the temperature sensor to affect the data! After those 10 seconds, the collection should be complete, and the contents of temp_log.csv will be printed to the screen.
You can view the contents of the log by entering cat temp_log.csv into the console.
Code to Note:
If you remember from our Programming in Python section, we covered how to create modules. Modules let you reuse code that exist in other files. In our case, we put the "measure temperature" section of the tmp102.py code into a function definition so that we may call it from another file.
In our main program (templogger.py), we imported our own module with import tmp102. Notice that we left out the .py suffix--Python knows to look for a .py file.
You'll also notice that whenever we open a file for reading or writing, we close it as soon as we can. It's generally not good practice to open a file and leave it open. If your program or operating system crashes while the file is open, you could potentially corrupt the file (or worse, the whole filesystem).
For extra protection, we add the writing section in a try block:
language:python
try:
    csv.write(entry)
finally:
    csv.close()
Now, if something crashes while the program is trying to write to the file, an exception will be thrown and Python will automatically close the file before exiting.
You can also see that how we access a file is given by the second parameter in the open() function:
- 'r' - Read
- 'w' - Write (this will erase the original contents of the file)
- 'a' - Append (this will keep the original contents and add your additions at the end)
datetime.datetime.now() returns a datetime object, which we convert into a string with str(). Note that this is based on the local time of your Raspberry Pi. You can get a Coordinated Universal Time (UTC) date and timestamp with datetime.datetime.utcnow().
Challenge: Open the temperature log in a spreadsheet program and create a graph showing how the temperature changed over those 10 seconds (for extra credit, change the program to measure temperature over a longer period of time). Hint: Raspbian comes with LibreOffice Calc, a free spreadsheet program. If you use Calc, the Data > Text to Columns function might help you convert your date/timestamps into something usable.
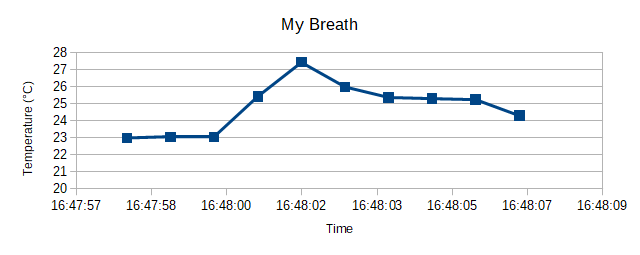
Headless: If you are using the Raspberry Pi as a headless device, you may want to print the contents of the CSV to the screen, and copy-and-paste them into a spreadsheet program on your host computer.
Solution: There's not really an "answer" to this. Get creative and show off your graphing skills!