AD8232 Heart Rate Monitor Hookup Guide
Troubleshooting and Tips & Tricks
ECG's are notoriously noisy. This is because you are measuring muscle activation. The furtherthe sensor pads are from the heart, the more muscle noise you will see. These are commonly referred to as "Motion Artifacts". So here are some simple tips to improve the signal quality.
- Keep sensor pads as close to the heart as you can.
- Make sure the RA and LA sensor pads are on correct sides of the heart.
- Try not to move too much while taking a measurement.
- Try to use fresh pads for each measurement. The pads loose the ability to pass signals with multiple applications.
- Prep and clean the area you plan to stick pads. This will help make a good connection (hair is not a good conductor).
- You may have to adjust sensor placement for different individuals.
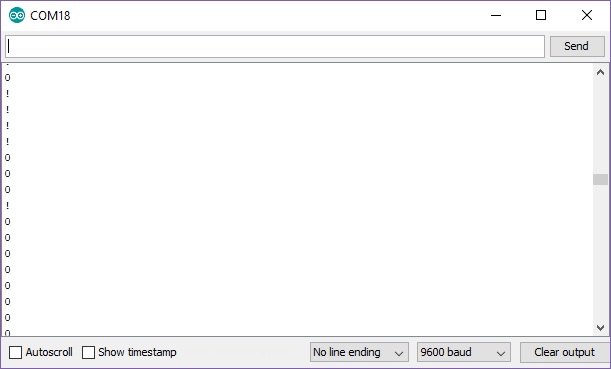
If the sensor pads are not placed correctly on the body or the cable is not connected, you may see an output similar to the image below in the serial monitor. The values will either clip the waveform between 0 and 1023 or display an "!".
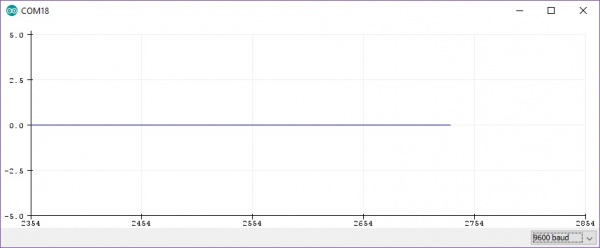
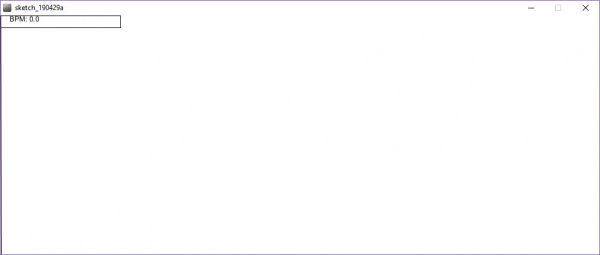
As a result, you will either see a flat line in the Arduino serial plotter or nothing will be drawn in the Processing's display window. If this happens, you'll need to check your solder joints and try placing the sensor pads to a different location around the body.
 |
 |
| Arduino Serial Plotter Displaying Flat Line |
Processing Sketch Displaying Nothing |
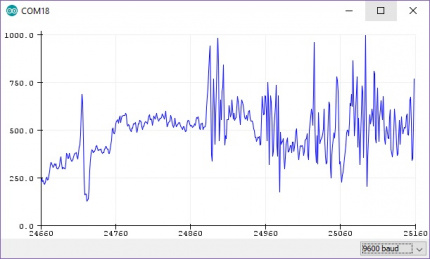
If you happen to moving a lot or flex your muscle, you will not get a distinct waveform. Make sure to remain still and relax as the sensor is taking measurements. You may see a few distinct waveforms but it will not be as reliable.
 |
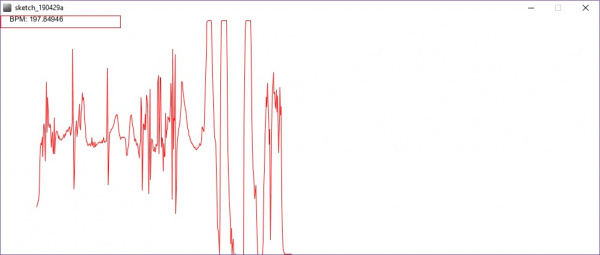 |
| Arduino Serial Plotter Displaying a Noisy Waveform |
Processing Sketch Displaying a Noisy Waveform |
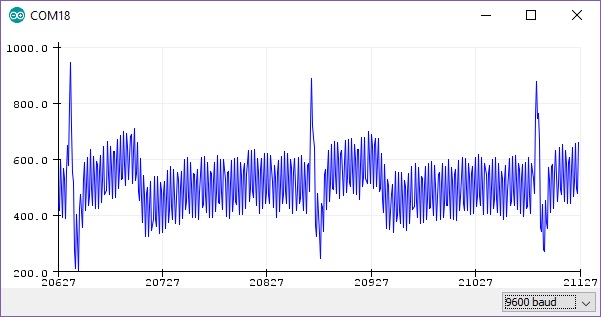
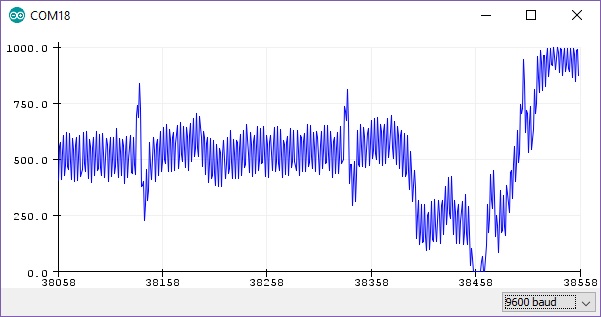
Depending on where the sensor pads are placed, you may still get a distinct waveform similar to the graphs displayed in the Arduino serial plotter below. You may notice the QT interval pulsing even though the center value is noisy. This is not as desirable as the waveforms shown earlier and the pads may need to be moved to a different location depending on your application. When inspecting the graph on the right further, you'll notice that there is a gradual spike at the end of the waveform. This was due to the sensor picking up movements from a user breathing deeply similar to when a user is moving a lot or flexing a muscle. If this happens, make sure to not force the breathing.
 |
 |
| Arduino Serial Plotter Displaying a Noisy Waveform with Distinct QT Intervals |
Arduino Serial Plotter Displaying a Noisy Waveform with Distinct QT Intervals and Motion Artifacts |
