Photon Remote Temperature Sensor
This Tutorial is Retired!
This tutorial covers concepts or technologies that are no longer current. It's still here for you to read and enjoy, but may not be as useful as our newest tutorials.
Introduction
Phant is No Longer in Operation
The scientific method allows us to examine the universe and its natural phenomena. Through collection and analysis of data, we discover historical trends to make predictions about future events. One such phenomenon that greatly impacts our daily, and long-term, lives is temperature. This tutorial shows you how to build your own remote temperature sensor that automatically uploads data to the data.sparkfun.com web service. This is a perfect, hands-on project for teaching, or learning, the difference between daily temperature fluctuations and average temperature over time, a particularly crucial distinction when discussing climate change.
This system uses the Particle Photon as the control device, a handy lil' microcontroller that easily connects to WiFi. The Photon reads in temperature data from the SparkFun TMP102 digital temperature sensor, then uploads the data to a web server for remote data acquisition and, if desired, subsequent analysis and plotting.
For all you visual learners, check out a video of the project below:
Materials
To follow along with this project at home, you'll need the following:
Electronics
- Particle Photon microcontroller
- SparkFun Photon Battery Shield
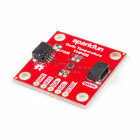
- TMP102 Digital Temperature Sensor
- 2.5 W Solar panel
- Polymer Lithium Ion Battery - 6 Ah
- Please note that the Battery Shield is intended to charge single-cell LiPo batteries. Using the triple-cell 6Ah battery will give you a longer battery life, but be aware that each cell may not be charged at the same rate.
- If you live in a sunnier climate than Seattle, you can use a lower capacity battery (e.g. 2000 mAh battery).
- Be careful with the JST connectors, and avoid pulling the wires, particularly when removing them. Check out this tutorial for an easy way to remove them.
- Six (6) Header pins
- Surface Mount DC Barrel Jack
- Four (4) Male-to-Female Breadboard Jumper Wires (or use 22-gauge insulated wire)
- Breadboard (and/or PCB board)
Here's a wish list of most of the parts mentioned above for your convenience.
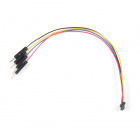
Qwiic Cable - Breadboard Jumper (4-pin)
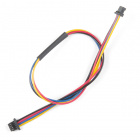
PRT-14425Qwiic Cable - 200mm
PRT-14428Casing and Installation
For electronics: Project box or waterproof tupperwear
There are tons of options for cases, just be sure it is durable, waterproof, and not made of metal (will block the WiFi signal).
Stand for solar panel (e.g. metal post, garden sign, plant holder, tripod, etc.)
While a stand is somewhat optional, it allows you to point the panel towards the sun and adjust it throughout the year to obtain maximum incident solar radiation. Check out your local thriftstore for inexpensive items to use as a stand. Be sure the stand and attached panel will withstand the elements (including wind). Alternatively, you can attach the solar panel directly to the temperature sensor case.
Tools
- Soldering iron and supplies
- Wire Strippers
- Multimeter
- Epoxy, or other electrically insulating adhesive
- Velcro (to adhere solar panel to stand)
- Drill or waterproofing electrical tape (for getting solar panel cable into case)
Recommended Reading
The goal of this tutorial is to give you enough information to get your remote temperature sensor up and running as quickly as possible, regardless of your background and experience with the components used in this project. As such, this tutorial provides only a brief mention of the underlying hardware and software elements. Check out the guides below for more in-depth information, including the I2C communication protocol used by the TMP102 sensor and the Phant library used by the data.sparkfun.com web service.
Hardware
- Guide to setting up the Particle Photon
- Guide for developing on the Photon
- Hookup Guide for Photon Battery Shield
- Datasheet for the TMP102
- Datasheets are your friend! It is highly recommended to review this datasheet, at the very least to get more familiar with datasheets.
Software
- The TMP102 temperature sensor uses I2C (Inter-Integrated Circuit) communication protocols. If you are new to this, here is a handy overview of the I2C protocol.
- This tutorial uses the data.sparkfun.com web server to host the temperature data stream.
Measuring Temperature
In our macroscopic world, temperature is a seemingly simple concept -- we intrinsically understand fundamental differences between hot objects and cold objects. Often we can estimate temperature just by looking at the object; if our stove burner is glowing red, we know that it is likely very hot and we should avoid touching it.
The standard definition of temperature is a measure of the average amount of heat, or thermal energy, of the particles in a substance. Since temperature is an average measurement, typically the size of the sample is irrelevant. For example, a small pot of boiling water will be at the same temperature as a large pot of boiling water (as long as you're at the same altitude!).
On the microscopic scale, temperature is a fairly complex phenomenon that corresponds to the molecular speed of individual atoms. In other words, temperature is a measure of the kinetic energy of the atoms that make up a particular substance. In general, for a given substance, the solid phase will have the lowest temperature because the atoms are mostly rigid, followed by the liquid phase in which atoms have more kinetic energy, and then the gaseous phase with the most energetic atoms. However, since mass is also a form of energy, less massive molecules need to have more kinetic energy to be at the same temperature as more massive molecules. This is why all three phases can exist at the same average temperature (e.g. gaseous oxygen, liquid water, solid metal).
Want to learn more about temperature? Check out this great resource.
Build It
Let's begin assembling our circuit.
Set up the Particle Photon.
Go to the Photon set up page and follow the instructions to set up your Photon for WiFi. The Photon LED will slowly pulse (aka breathe) light blue (cyan) when it is successfully connected to WiFi. Run through a practice program to check that the Photon is working as expected. The classic Blink sketch is always a good choice.
To program the Photon, we used the Particle Build Web IDE (Integrated Development Environment). Visit the Particle website to guide you through this process.
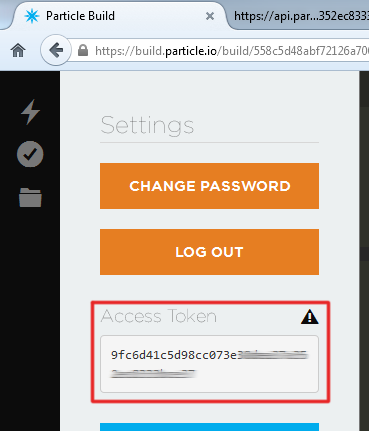
Locate your specific Photon "Device ID" and the "Access Token". Store in a convenient, and secure, location.
The device ID can be found in Particle Build by clicking the '>' next to your device name.
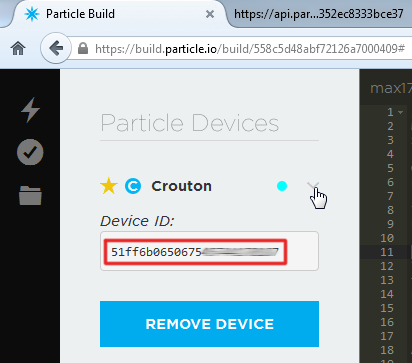
_Find your Device ID under the "Devices" tab, by clicking the carrot next to your Photon._ Your access token can be found under the "Settings" tab.
_Find your access token under the "Settings" tab._ Solder header pins to the SparkFun temperature sensor (TMP102).
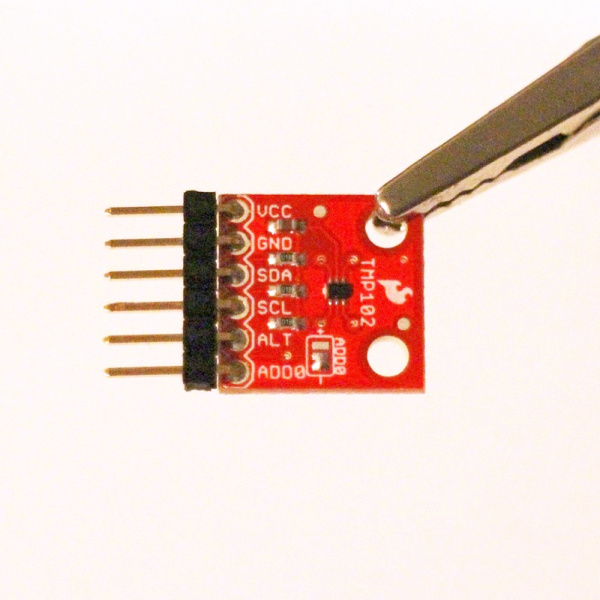
Solder the DC barrel jack onto the bottom of the Photon Battery Shield.
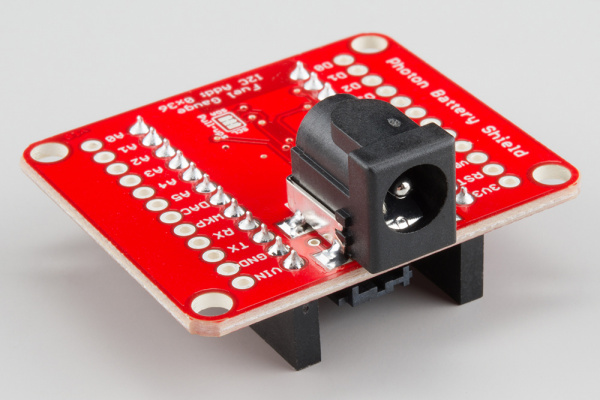
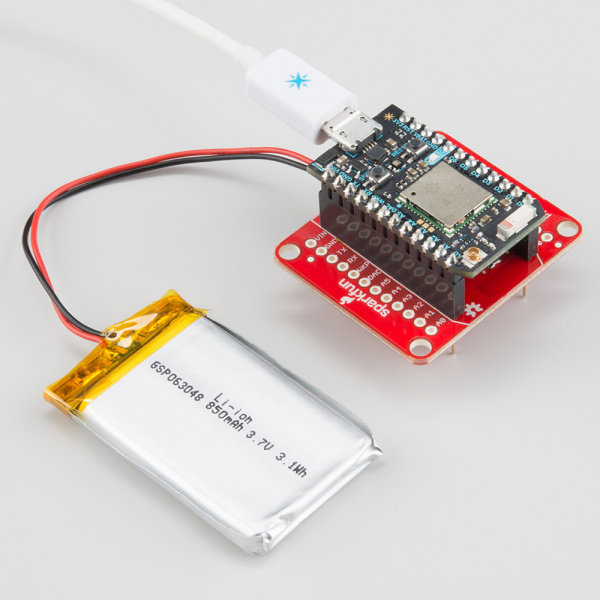
Plug the Photon into the Photon Battery Shield. Be sure that the rounded edges of the Photon line up with the rounded lines on the battery shield. Connect the battery and solar panel to the respective connectors. Check that the Photon powers on and connects to WiFi.
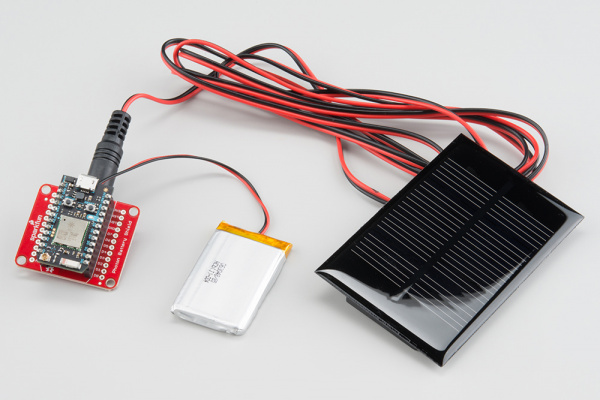
Connect the TMP102 temperature sensor to Photon battery shield pins with the breadboard jumper wires (or stranded 22 gauge insulated wire).
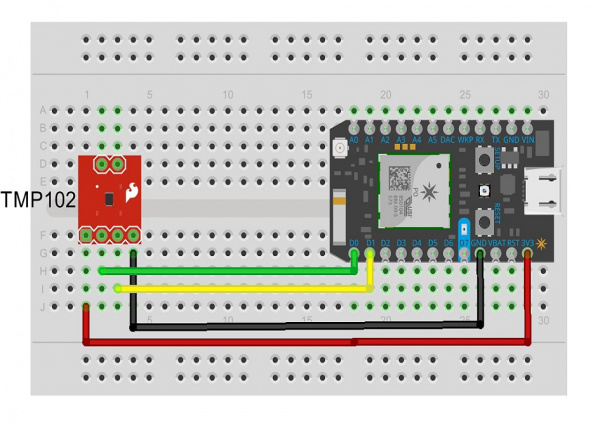
The green wire corresponds to the SDA pins, yellow wire to the SCL pins. This project only needs four (4) of the six (6) pins on the TMP102: VCC, GND, SDA and SCL. If you want to connect multiple temperature sensors using the I2C lines, you can use the ADDR0 pin to changes the device address for each sensor (See the I2C communication tutorial for help with this).
Connect TMP102 VCC pin to the Photon 3.3V source and GND to a Photon GND pin. Connect the TMP102 SDA pin to the Photon D0 pin and the SCL pin to the Photon D1 pin.
You can keep the final system on a breadboard or transfer it to a PCB board.
Program It
Read in the TMP102 Temperature Sensor
The program provided below is designed to function essentially as-is, with only a few minor changes necessary to get the system up and running. Unless you want to add more sensors, or use different sensors, you do not need to change the program code to read in the TMP102 temperature data. That said, if you are new to electronics, or I2C communication, it is still helpful to understand the basics of how the TMP102 sends data, particularly when debugging.
Quick Overview of TMP102 Data Signal
The TMP102 temperature sensor uses I2C communication, a two-wire serial interface. The two lines are SDA (Data) and SCL (Clock). The corresponding Photon pins are D0 (SDA) and D1 (SCL). The program below uses the default address of 72 (code variable TEMP102_ADDRESS) for the TMP102 sensor.
The TMP102 sensor outputs two bytes in binary (code variable BYTES_TO_READ). The first byte is the most significant byte (MSB), and the second byte is the least significant byte (LSB). The first 12 bits (out of 16) are used to indicate temperature, where one LSB is 0.0625 °C. The program is commented where these operations occur.
Review the TMP102 data sheet for more information.
Set up a Data Host
This system uses the data.sparkfun.com web service to log the TMP102 temperature data. You can remotely access the temperature data using the public URL generated when you create your data stream. To use the program provided in the next section, follow the procedure below to set up a data stream on the data.sparkfun.com server.
Create a data stream on the data.sparkfun.com service by clicking the Create button.
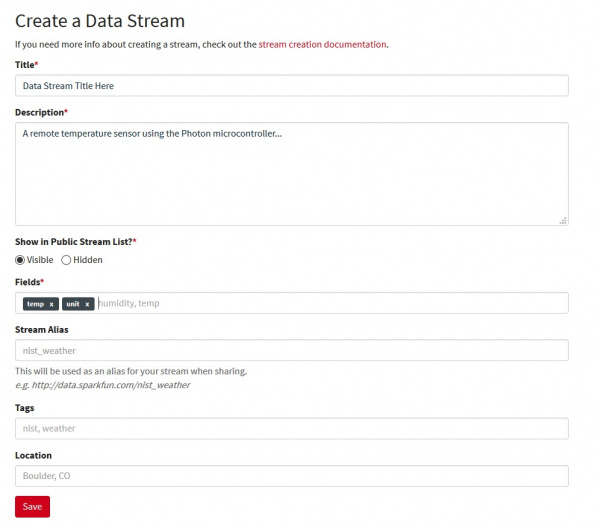
Fill in your desired title and description.
For the fields section, input "temp" and "unit". It is imperative to use these exact field names (all lower case) or the data will not upload unless you change the respective field names in the program.
Save the data stream. This will redirect you to the stream's key page. Copy all of this information and store in a secure location.
A quick overview of the keys:
Public Key – This is a long hash that is used to identify your stream and provide a unique URL. This key is publicly visible, meaning that anyone who visits your stream’s URL will be able to see this hash.
Private Key – The private key is necessary to post data to the stream. Only you should know this key.
Delete Key – This key deletes the stream, so normally you’ll want to avoid this key. Only use this key if you need to fix the field names or if you truly want to delete the data stream.
Fields – In our program, our fields are "temp", which corresponds to the temperature reading in degrees Celsius, and "unit", to let us know that our reading is in degrees Celsius. These fields set specific values and create a new log of data.
The timestamp generated is given in the UTC (Universal Time Coordinate) timezone. The easiest way to handle this timezone is to convert it to your local timezone once you've downloaded the data.
To monitor the Photon output, use the Particle driver download as described in the "Connecting Your Device" Photon tutorial.
To view the particle serial monitor, in the command prompt type
particle serial monitor. This is extremely helpful for debugging and checking to be sure the Photon is posting data to your host. The program provided in the next section includes print statements that indicate the status of the data acquisition and upload process to help facilitate the setup process. You can also use any of the serial terminals mentioned in our Serial Terminal Baiscs tutorial to view serial data from your Photon.
System Code
What you need to change in the program:
Copy and paste your data stream public key to the array called
publicKey[].const char publicKey[] = "INSERT_PUBLIC_KEY_HERE";Copy and paste your data stream private key to the array called
privateKey[].const char privateKey[] = "INSERT_PRIVATE_KEY_HERE";
What you may want to change in the program:
The posting rate (code variable
postingRate) sets how often the temperature data is uploaded to the data stream. The current post rate is ~ 20s (20000 ms). You can set a different value in line 23 of the program, reproduced below. The maximum post rate allowed by the data.sparkfun.com host is about one data point every 10 seconds (100 posts every 15 minutes).const unsigned long postingRate = 20000; //post rate to data.sparkfun.com (time in milliseconds)The temperature unit (currently in °C).
To upload data in °F, multiply
temp(line 47) by 1.8 and add 32, as shown below.int temp = (((( MSB << 8) | LSB) >> 4) * 0.0625)*1.8 + 32;Be sure to update the output unit from "C" to "F" in line 51:
postToPhant(temp, 'F');If you are comfortable with code, feel free to change anything else you want!
Photon Remote Temperature Sensor Program
You can grab the code from below, or you can get the most up to date files from the GitHub repository.
language:c
//This code was written by Ace Levenberg <acelevenberg@gmail.com> and Jennifer Fox <jenfoxbot@gmail.com>
/*
 * ----------------------------------------------------------------------------
 * "THE BEER-WARE LICENSE" (Revision 42):
 * <jenfoxbot@gmail.com> and <acelevenberg@gmail.com> wrote this file.  As long as you retain this notice you
 * can do whatever you want with this stuff. If we meet some day, and you think
 * this stuff is worth it, you can buy me a beer in return.
 * ----------------------------------------------------------------------------
 */


// This #include statement was automatically added by the Particle IDE.
//This library is used to push data to the data.sparkfun.com server.
#include "SparkFunPhant/SparkFunPhant.h"

const char server[] = "data.sparkfun.com"; // Phant destination server
const char publicKey[] = "INSERT_PUBLIC_KEY_HERE"; // Phant public key
const char privateKey[] = "INSERT_PRIVATE_KEY_HERE"; // Phant private key

Phant phant(server, publicKey, privateKey); // Create a Phant object


const unsigned long postingRate = 20000; //Post rate to data.sparkfun.com (time in milliseconds)
unsigned long lastPost = millis();

const int TEMP102_ADDRESS = 72; //Address of TMP102
const int BYTES_TO_READ = 2; //Number of bytes to read in from TMP102 (should always be 2)

void setup() {
    Wire.begin(); //Initialize serial communication library
    Serial.begin(9600);
}

void loop() {
    if (Wire.isEnabled()) //Check if receiving a signal from I2C pins
    {
        if (lastPost + postingRate < millis()) //Wait to post until ~ 20s has lapsed
        {
            Serial.print("Requesting from :");
            Serial.println(TEMP102_ADDRESS);
            Wire.requestFrom(TEMP102_ADDRESS, BYTES_TO_READ);
            if (Wire.available() == BYTES_TO_READ)
            {
                Serial.println("Reading!");
                byte MSB = Wire.read();
                byte LSB = Wire.read();
                int temp = ((( MSB << 8) | LSB) >> 4) * 0.0625; //Remove 4 empty bits from 2nd byte (see datasheet),
                //combine 1st byte and 2nd byte then use conversion factor to get temp in deg. C (see datasheet)
                Serial.print("Temp is :");
                Serial.println(temp);
                postToPhant(temp, 'C'); //Post temperature data and unit (deg C) to your data stream at data.sparkfun.com (See lines 68 and on)
                lastPost = millis();
            }
            else
            {
                Serial.println("Unable to read the temperature"); //Used for debugging TMP102 output
            }
        }
    }
    else
    {
        Serial.println("Wire is not enabled make sure to call Wire.begin()"); //Used for debugging I2C protocol
    }
}

//Thanks Jim Lindblom <jim@sparkfun.com> for the sample code and Phant library.
int postToPhant(int temp, char unit){

    phant.add("temp", temp); //Data stream field name "temp"
    phant.add("unit", unit); //Data stream field name "unit"
    TCPClient client;
    char response[512];
    int i = 0;
    int retVal = 0;

    if (client.connect(server, 80)) // Connect to the server
    {
        // Post message to indicate connect success
        Serial.println("Posting!");

        // phant.post() will return a string formatted as an HTTP POST.
        // It'll include all of the field/data values we added before.
        // Use client.print() to send that string to the server.
        client.print(phant.post());
        delay(1000);
        // Now we'll do some simple checking to see what (if any) response
        // the server gives us.
        while (client.available())
        {
            char c = client.read();
            Serial.print(c);    // Print the response for debugging help.
            if (i < 512)
                response[i++] = c; // Add character to response string
        }
        // Search the response string for "200 OK", if that's found the post
        // succeeded.
        if (strstr(response, "200 OK"))
        {
            Serial.println("Post success!");
            retVal = 1;
        }
        else if (strstr(response, "400 Bad Request"))
        {   // "400 Bad Request" means the Phant POST was formatted incorrectly.
            // This most commonly ocurrs because a field is either missing,
            // duplicated, or misspelled.
            Serial.println("Bad request");
            retVal = -1;
        }
        else
        {
            // Otherwise we got a response we weren't looking for.
            retVal = -2;
        }
    }
    else
    {   // If the connection failed, print a message:
        Serial.println("connection failed");
        retVal = -3;
    }
    client.stop();  // Close the connection to server.
    return retVal;  // Return error (or success) code.
}
Test, Encase and Install
Plug battery and solar panel into Photon battery shield. Check that the Photon successfully powers on, connects to WiFi (the Photon LED will be breathing cyan), and sends temperature data to your data stream (accessible via the public URL).
Coat electrical connections in epoxy or other (ideally waterproof) adhesive.
Please note that epoxy is very permanent. If you intend to modify the project or use the components for another project in the future, use an adhesive method that is removable, like hot glue.
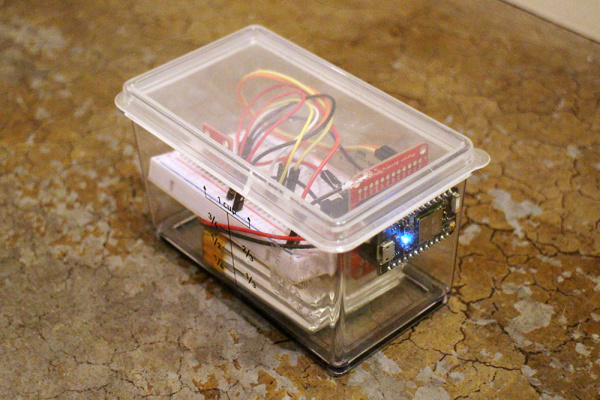
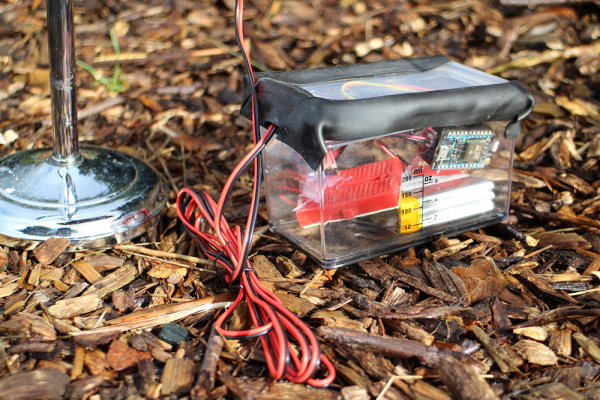
Place electronics (except solar panel) in project case. Determine where the solar panel cable will enter the case. Use waterproofing electrical tape to seal area around solar panel cable or a drill hole in the case for the solar panel cable (coat exterior in waterproofing tape or epoxy). If you place the temperature sensor inside the case, ensure that there is sufficient air ventilation to avoid turning the project case into a sauna.
Be sure that the wires are not stretched or bent much as this will cause breakage over time.
Seal any remaining holes or other air gaps with waterproofing electrical tape or epoxy. If you are sealing the project case lid, it is highly recommended to use a removable sealant like the waterproofing electrical tape to access the electronics in the future.
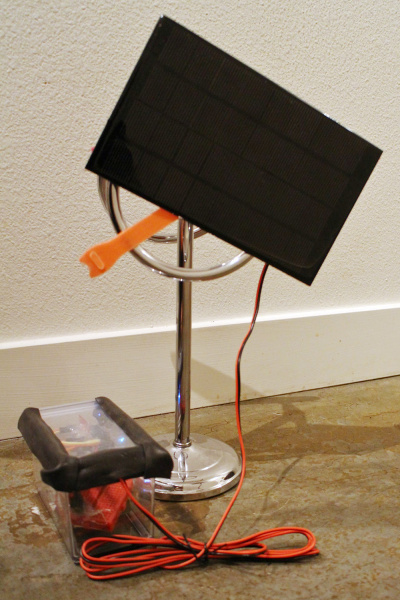
Connect solar panel to stand.
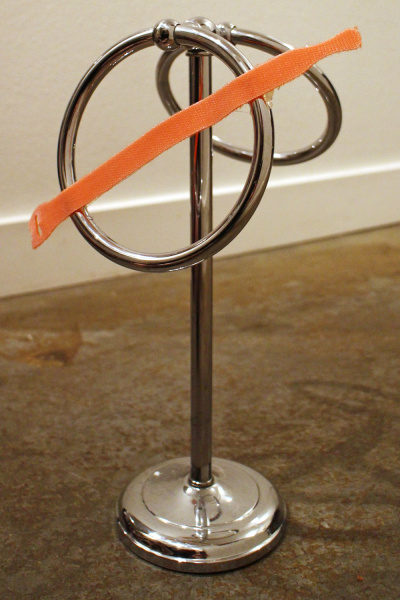
The stand in this example is a towel rack found at a local thrift store. This was perfect for my needs because 1) it was very inexpensive and 2) the rings are adjustable, which allows me to change the orientation of the solar panel to point it towards the maximum incident solar radiation (aka sunlight) depending on where it is installed outdoors and the current season (since the sun's path changes depending on the seasons).
There are tons of options for a stand! Peruse your garage/basement/attic/cupboards/closets or check out the outdoor section of a local thrift store or hardware store. Look for objects that can withstand nature's elements, will maintain ridigity, and can support the solar panel weight.
Once the case and stand are complete, connect the battery and solar panel to the Photon battery shield. Check that the Photon is adequately powered, connected to WiFi (pulsing light blue), and is uploading data to your data.sparkfun.com data stream.
The battery used in this tutorial has a capacity of 6Ah (Amp-hours), which means it can provide 6A for 1 hour. The Photon microcontroller average power consumption is between 80 - 100 mA. Assuming maximum current draw of 0.1A, this means that the battery can power the system for ~60 hours (2.5 days) without any charge from the solar panel. This is ideal/necessary for cloudy locations (like Seattle where this project was designed and built) or for remote sites that are difficult to access on a daily basis.
If you use a different battery, calculate the total number of hours the battery can power the Photon, without being charged by the solar panel. Do this by dividing the battery capacity (given in Amp-hours) by the Photon maximum current draw (0.1A). Since the sun hides behind the other side of the planet at night, be sure that your battery can provide power for at least 10-12 hours.
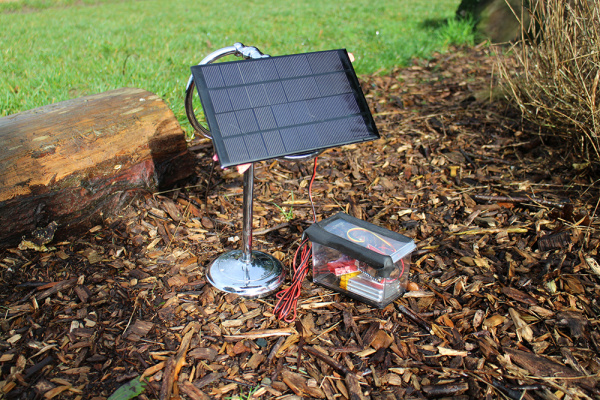
Install the system within reach of the WiFi signal for which it is configured -- the Photon will flash green if it is not connected to WiFi.
Be sure to place the temperature sensor in a shady location, avoiding direct sunlight, as incident solar radiation will increase the temperature measurement.
Place the solar panel in the sunniest spot available at your chosen location. Determine the optimum solar angle for your panel, and point the solar panel in that direction. You'll want to change this angle over the course of the year as the sun's angle changes (higher in the summer, lower in the winter, also highly dependent on location). Here's a great online calculator to help you determine the optimal solar angle in your particular city.
Data Acquisition and Analysis
The data.sparkfun.com service allows you to download your data in a few different formats, so pick the format that is easiest for you to handle. Most common data analysis programs, including Excel, R, and Python, can handle CSV (Comma Separated Values) files.
Below is one method to plot your data using a program written for the R platform, a free statistical software environment.
Download your data in CSV file format (button is located at the top of the data stream).
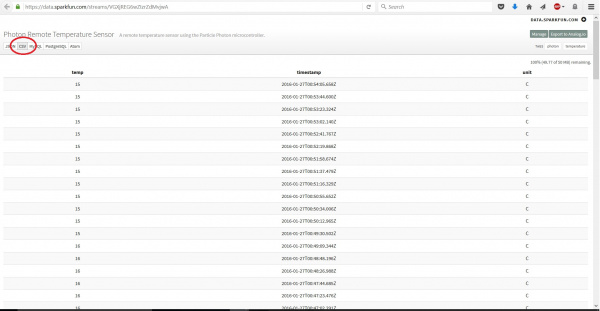
In the R workspace, run the program below to generate a plot and basic analysis of your data. You can also get the most up to date files from the GitHub repository.
#Photon Remote Temperature Sensor Data Plot and Analysis
#Code written by Jennifer Fox


tempPlot = function(file = ''){
    default = "C:\\test\\*.txt"

    #Load in CSV text file
    if (file == '') file = file.choose()

    #Set data into matrix
    headers = c("Temp_C", "Unit_C", "Timestamp")
    temp_raw = read.table(file, sep = ",", quote = "", skip = 1, fill = TRUE, col.names = headers)

    #Add in degrees Fahrenheit
    tempF = matrix(nrow = length(temp_raw[,1]), ncol = 2, byrow = TRUE)
    tempF[,1] = temp_raw[,1]*1.8+32
    tempF[,2] = "F"
    temp_raw[,c("Temp_F","Unit_F")] = c(as.numeric(tempF[1:length(tempF[,1]),1]), tempF[,2])
    temp = temp_raw[,c(1,2,4,5,3)]

    #Convert UTC timestamp into local (sensor) timezone
    timestamp_raw = temp$Timestamp
    ts_placeholder = gsub("T", " ", timestamp_raw)
    timestamp = gsub("Z", "", ts_placeholder)
    UTC_timezone = as.POSIXct(timestamp, tz="UTC")
    my_timezone = format(UTC_timezone, tz = Sys.timezone()) #Sys.timezone() outputs the local timezone

    #Replace temp data with local timezone
    temp$Timestamp = my_timezone

    #Plot temperature data
    plot(as.POSIXct(temp$Timestamp), temp$Temp_C, main = "Temperature (°C) vs. Time", ylab = "Temperature (°C)", xlab = "Time", xaxt = "n", pch = 20)
    axis.POSIXct(1, my_timezone, labels = TRUE) #Use the "format" argument to adjust the axis label (e.g. to print hours use: format = "%H:00" )
    dev.new()
    plot(temp$Timestamp, temp$Temp_F, main = "Temperature (°F) vs. Time", ylab = "Temperature (°F)", xlab = "Time", xaxt = "n", pch = 20)
    axis.POSIXct(1, my_timezone, labels = TRUE)

    #Calculate and output basic statistical analysis
    end_date = temp$Timestamp[1]
    start_date = temp$Timestamp[length(temp$Timestamp)]
    t_F = summary(as.numeric(temp$Temp_F))
    t_C = summary(as.numeric(temp$Temp_C))

    cat("Data Stream Start Date:", as.character(start_date), "\n", "Data Stream End Date:", as.character(end_date), "\n\n")
    cat("Summary of Temperature Data (°C)", "\n", "Average (Mean) Temperature: ", t_C["Mean"] ,"\n", "Minimum Temp: ", t_C["Min."], "\n", "Maximum Temp: ", t_C["Max."], "\n")
    cat("Summary of Temperature Data (°F)", "\n", "Average (Mean) Temp: ", t_F["Mean"] ,"\n", "Minimum Temp: ", t_F["Min."], "\n", "Maximum Temp: ", t_F["Max."], "\n")
}
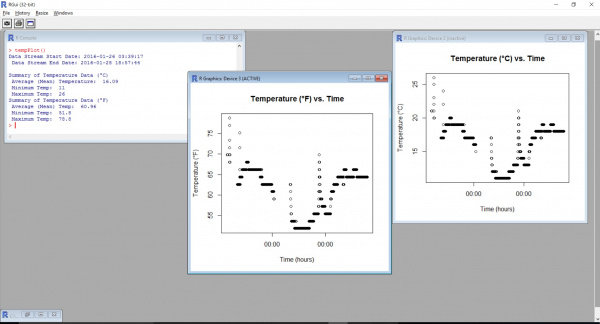
The following shows the plots from the set of data collected during this project.
Education Extension
Building this remote temperature sensor teaches practical, hands-on skills in hardware and software engineering. Beyond direct project-based learning, there are tons of ways to extend this project for classroom and other citizen science activities. Here are a few ways to use this system to teach fundamental scientific concepts.
What is Temperature?
This system measures temperature at a very specific, and known, location, which allows us to combine our direct observations with experimental data. Create your own experiment to change the temperature reading by changing the outside environment, keeping everything else the same.
For example, move the temperature sensor into direct sunlight, and gather data over a specific time interval, then move the temperature sensor back into the shade for the same amount of time. Analyze how the temperature reading changes and compare it to your own observations of outside temperature. Experiment with different ways to change the temperature reading. Be creative*, and see what tests your students think up!
* Avoid water contact unless you've thoroughly coated the electrical connections in epoxy or other waterproof adhesive.
Heat Capacity: Comparison of Temperature and Heat
Build the temperature sensor case to be air-tight, then use different material types and/or sizes of enclosures to analyze the difference between temperature and heat. Different materials have different heat capacities, or the amount of heat needed to raise the material's temperature by one degree. In other words, materials absorb and retain heat at varying rates. This helps us understand that heat is a form of energy, while temperature is a measure of that energy.
For each case, place sensor in direct sunlight and leave overnight. Determine how quickly the temperature sensor reading increases and decreases. A high heat capacity material will slowly increase and decrease in temperature, whereas a low heat capacity material will quickly heat up and cool off. Create plots of the temperature changes for various cases to determine what types of materials, and what sizes, retain heat the most. Find patterns between different material types and use those patterns to determine why certain materials have higher heat capacities.
Analysis of Data Trends: Long-Term vs. Short-Term
The difference between daily temperature and average temperature is a crucial concept in understanding climate change. It also provides a real-world application of the difference between long- and short-term trends. Fortunately, the data.sparkfun.com service makes this analysis simple and straightforward, the hardest part is waiting! It is also suggested to have a back-up battery if you live in a cloudy climate (like Seattle).
For this science lesson, gather data for a minimum of two (2) to three (3) months, ideally through a seasonal change. Download the data and find the average (mean) temperature by day, week, and month. Select a few 24-hour periods to plot temperature, and compare daily fluctuations with your calculated averages. See if you can use the temperature data to pinpoint the changing seasons!
Resources and Going Further
- Having trouble with the Photon? Check out the Community Forum to see issues raised by other folks or to post a question of your own.
- Add more sensors! Here's a link to a variety of sensors available at SparkFun.
- Check out this awesome Photon Weather Shield project for a full-fledged weather monitor.
- Here's another great Photon project tutorial to hook up an accelerometer, gyroscope, and magnetometer!
Looking for more weather fun? Check out these other SparkFun tutorials:

