Graph Sensor Data with Python and Matplotlib
Introduction
Python is a wonderful high-level programming language that lets us quickly capture data, perform calculations, and even make simple drawings, such as graphs. Several graphical libraries are available for us to use, but we will be focusing on matplotlib in this guide. Matplotlib was created as a plotting tool to rival those found in other software packages, such as MATLAB. Creating 2D graphs to demonstrate mathematical concepts, visualize statistics, or monitor sensor data can be accomplished in just a few lines of code with matplotlib.
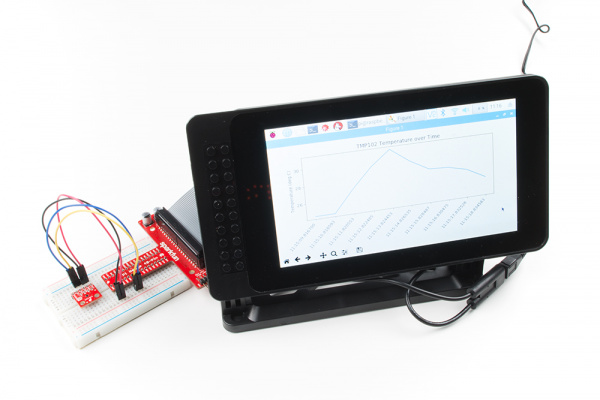
The Raspberry Pi is a great platform for connecting sensors (thanks to the exposed GPIO pins), collecting data via Python, and displaying live plots on a monitor.
Required Materials
To work through the activities in this tutorial, you will need a few pieces of hardware:
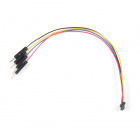
Qwiic Cable - Breadboard Jumper (4-pin)
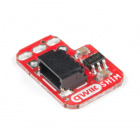
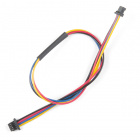
PRT-14425Qwiic Cable - 200mm
PRT-14428Optional Materials
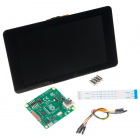
You have several options when it comes to working with the Raspberry Pi. Most commonly, the Pi is used as a standalone computer, which requires a monitor, keyboard, and mouse (listed below). To save on costs, the Pi can also be used as a headless computer (without a monitor, keyboard, and mouse).
Note that for this tutorial, you will need access to the Raspbian (or other Linux) graphical interface (known as the desktop). As a result, the two recommended ways to interact with your Pi is through a monitor, keyboard, and mouse or by using Virtual Network Computing (VNC).
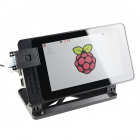
SmartiPi Touch
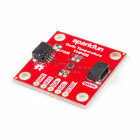
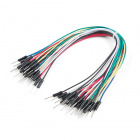
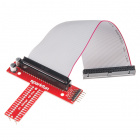
PRT-14059At the bare minimum, you need a breadboard and some jumper wires to connect the Pi to the TMP102 sensor. However, the Pi Wedge and some M/M jumper wires may make prototyping easier.
Suggested Reading
If you aren't familiar with the following concepts, we recommend checking out these tutorials before continuing:
Serial Terminal Basics
Raspberry Pi 3 Starter Kit Hookup Guide
Getting Started with the Raspberry Pi Zero Wireless
Python Programming Tutorial: Getting Started with the Raspberry Pi

