Graph Sensor Data with Python and Matplotlib
Speeding Up the Plot Animation
Clearing a graph and redrawing everything can be a time-consuming process (at least in terms of computer time). As a result, our Raspberry Pi can struggle keeping up with more animations when we push it past about 2-3 frames per second (fps). To remedy that, we are going to use a trick known as blitting.
Blitting is an old computer graphics technique where several graphical bitmaps are combined into one. This way, only one needed to be updated at a time, saving the computer from having to redraw the whole scene every time.
Matplotlib allows us to enable blitting in FuncAnimation, but it means we need to re-write how some of the animate() function works. To reap the true benefits of blitting, we need to set a static background, which means the axes can't scale and we can't show moving timestamps anymore.
Animation with Blitting Code
Open a new file in the same directory as our tmp102.py module, and copy in the following code:
language:python
import matplotlib.pyplot as plt
import matplotlib.animation as animation
import tmp102

# Parameters
x_len = 200         # Number of points to display
y_range = [10, 40]  # Range of possible Y values to display

# Create figure for plotting
fig = plt.figure()
ax = fig.add_subplot(1, 1, 1)
xs = list(range(0, 200))
ys = [0] * x_len
ax.set_ylim(y_range)

# Initialize communication with TMP102
tmp102.init()

# Create a blank line. We will update the line in animate
line, = ax.plot(xs, ys)

# Add labels
plt.title('TMP102 Temperature over Time')
plt.xlabel('Samples')
plt.ylabel('Temperature (deg C)')

# This function is called periodically from FuncAnimation
def animate(i, ys):

    # Read temperature (Celsius) from TMP102
    temp_c = round(tmp102.read_temp(), 2)

    # Add y to list
    ys.append(temp_c)

    # Limit y list to set number of items
    ys = ys[-x_len:]

    # Update line with new Y values
    line.set_ydata(ys)

    return line,

# Set up plot to call animate() function periodically
ani = animation.FuncAnimation(fig,
    animate,
    fargs=(ys,),
    interval=50,
    blit=True)
plt.show()
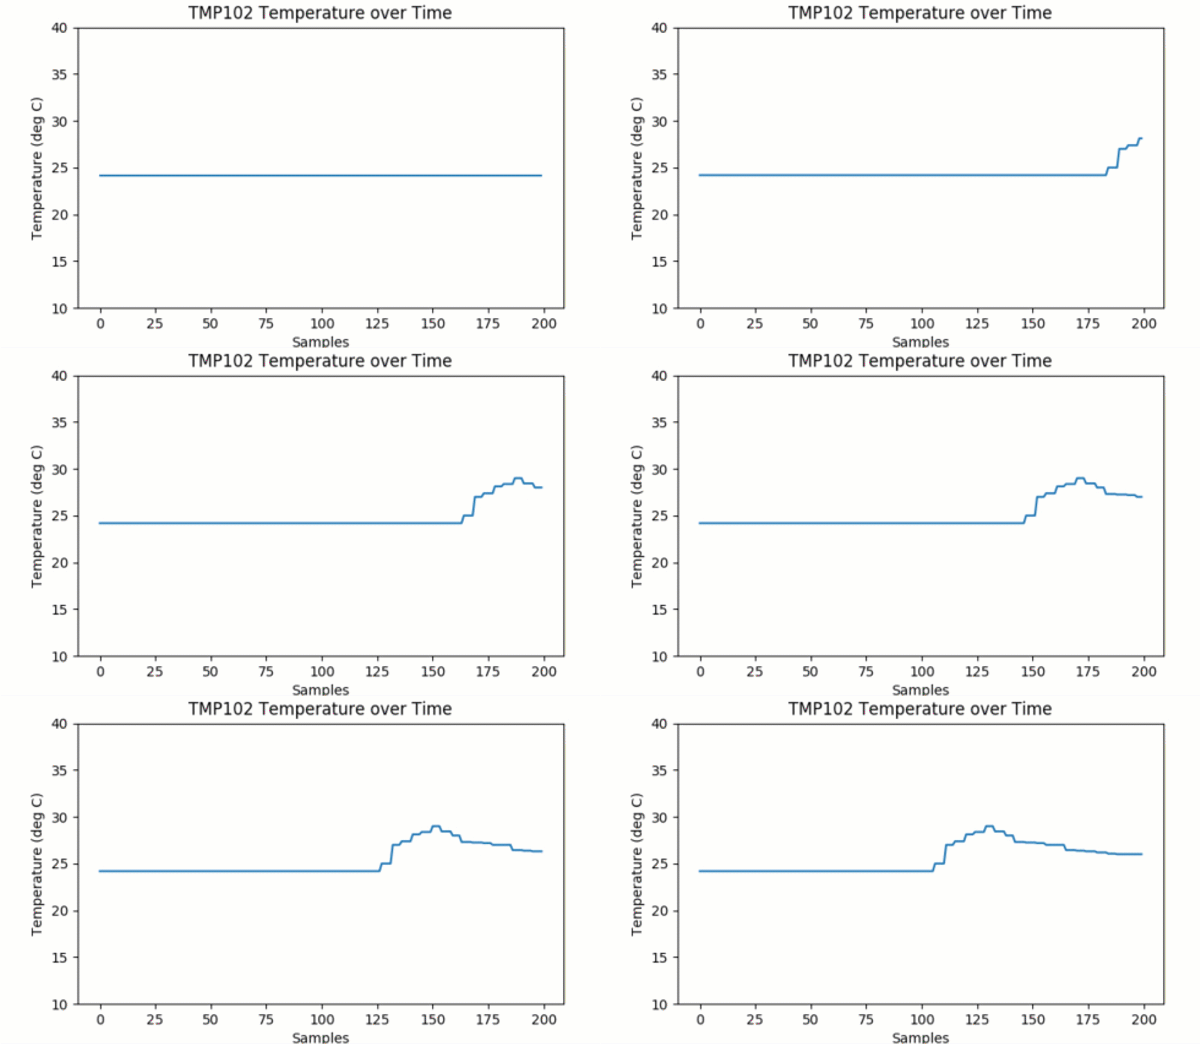
Save and run the code. A graph should appear with a line that animates much faster than in the previous example (i.e. around 20 fps). You should also note that there are no timestamps (i.e. the x axis does not contain any useful data), and the y axis (temperature) does not automatically scale. In fact, if you were to measure a temperature below 10° or above 40° C, it would not be drawn on the graph.
Code to Note
First, notice that we removed any reference to datetime or timestamps, as they won't help us with fast plotting here. Feel free to add them back in if you would like to enable some type of logging, but remember that it will slow down the animation.
Next, we set up a number of static parameters. x_len is the number of elements we want to use to create the plot. In this case, we remove elements from the beginning of the list when the plot gets to be more than 200 elements. We also set up a static y_range, which is the minimum and maximum temperature that can be displayed on the graph. To keep things fast, we don't want to redraw the y axis every frame!
In the animate() function, we only deal with the list of y (temperature) elements, as we know that the x axis doesn't change. Additionally, instead of redrawing the axes ax as in the previous example, we only update the line object, which we got a handle to earlier in the code:
line, = ax.plot(xs, ys)
The trailing comma on line, allows us to "unpack" the single-element tuple returned by the ax.plot() function. ax.plot() returns a tuple of Line2D objects (in this case, there should be only one Line2D object). As a result, we want a handle to the first object, so we use the trailing comma to say that we want the first object in the tuple and not the whole list itself. See here for more about trailing commas in Python.
After updating the Line2D object with line.set_ydata(ys), we package it into another single-element tuple with return line,, as FuncAnimation() expects our animation function to return a tuple of Line2D objects.
With these changes, we can set the blit parameter to True in our call to FuncAnimation(). This changes the way FuncAnimation() works on the back end to only update the line while leaving the background (everything else) unchanged.
