Graph Sensor Data with Python and Matplotlib
 Shawn Hymel
Hardware Assembly
In this guide, we will read temperature data from a TMP102 temperature sensor and plot it in various ways using matplotlib. After a brief introduction to matplotlib, we will capture data before plotting it, then we'll plot temperature in real time as it is read, and finally, we'll show you how to speed up the plotting animation if you want to show faster trends.
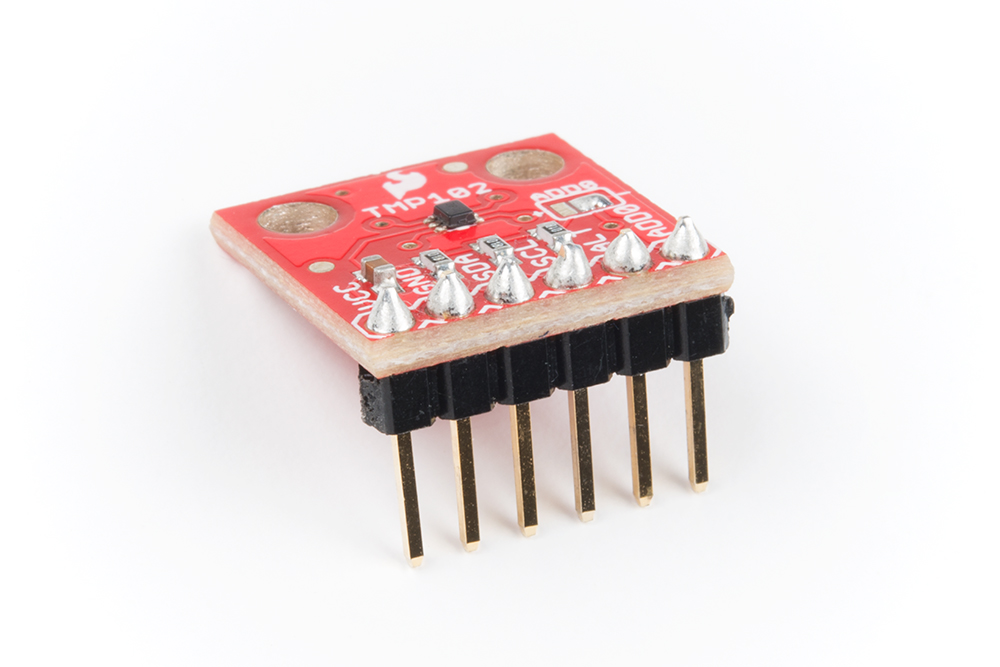
To begin, you'll need to connect the TMP102 to the Raspberry Pi, either directly or through a Pi Wedge. We recommend soldering headers onto the TMP102 if you plan to use a breadboard. If you need help, this tutorial shows you the basics of soldering.
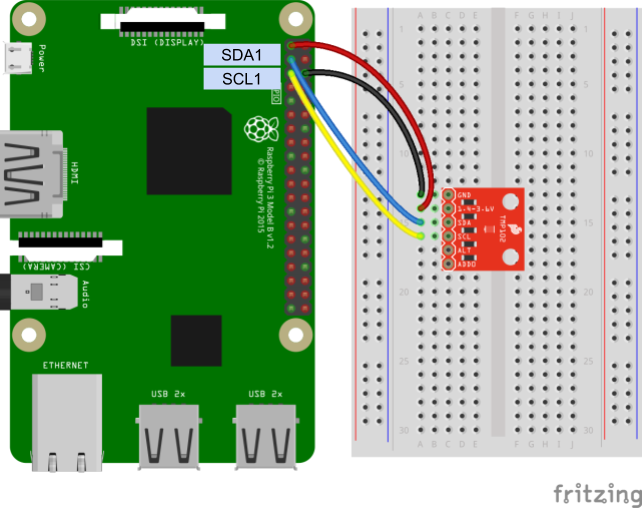
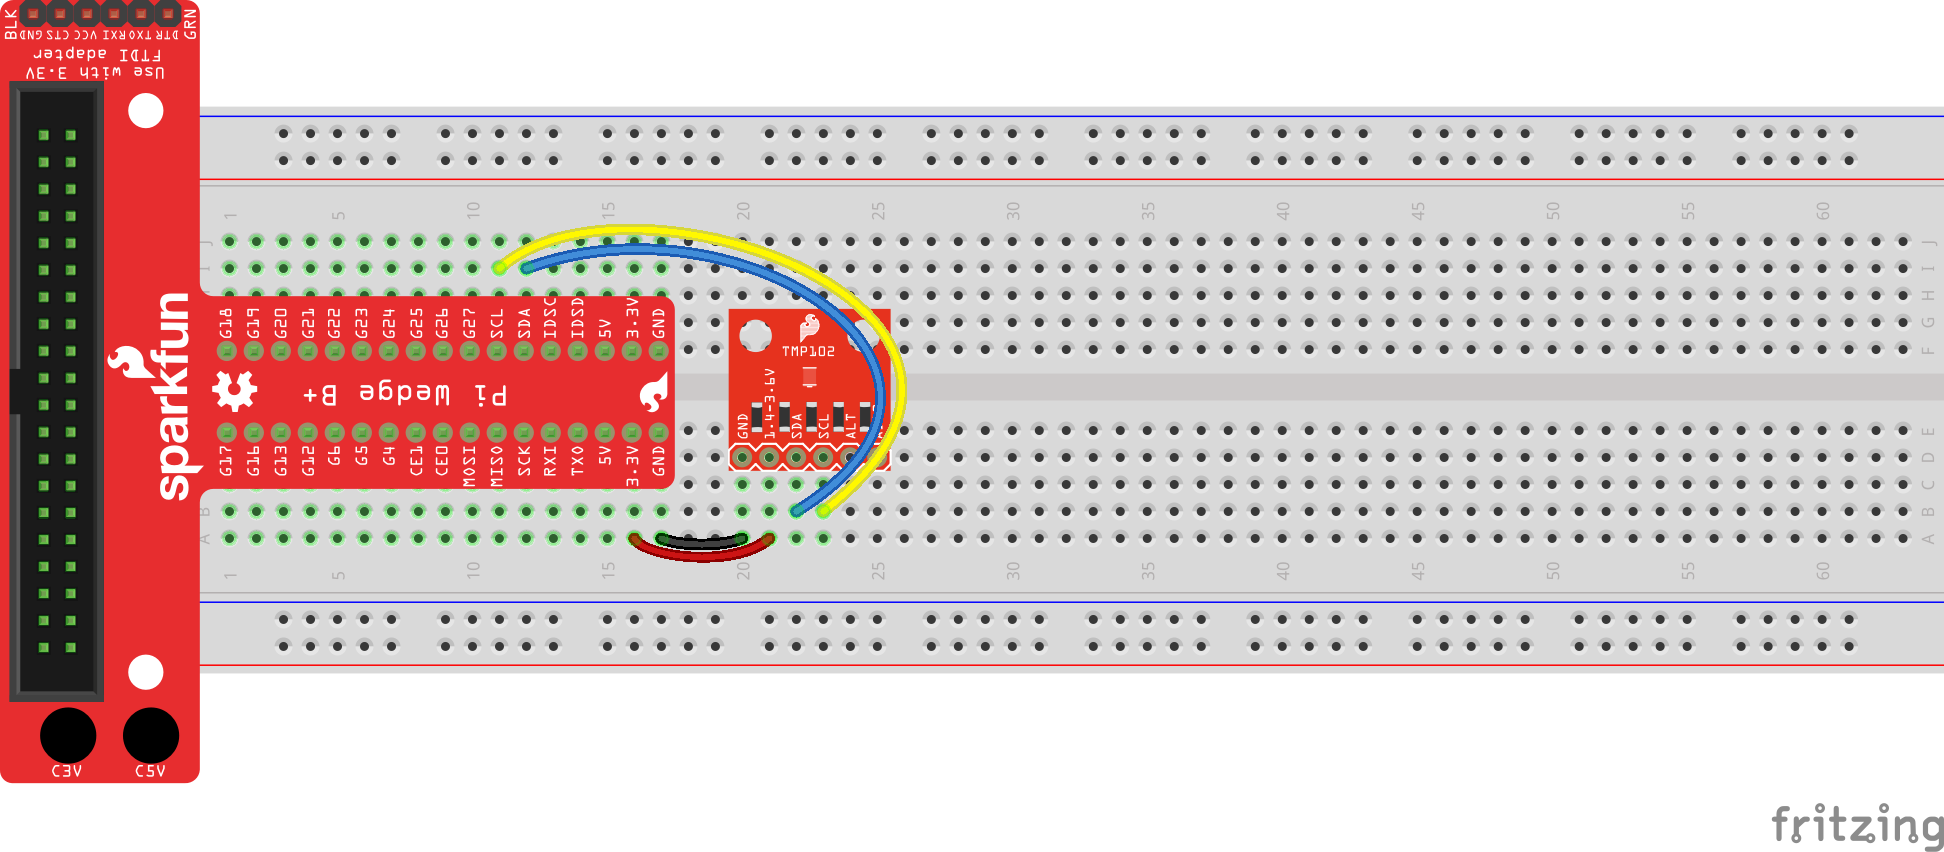
Connect the TMP102 as shown in one of the following diagrams (with or without the Pi Wedge). If you need help with layout of the Pi's GPIO headers, refer to this guide.
Connecting through a Pi Wedge:
Connecting directly to the Raspberry Pi: