Logging Data to Google Sheets with the Tessel 2
 D___Run___
Firmware: Logging Data with `fs`
Node.js has a number of built in-modules to keep your project as modular and streamlined as possible. You can find the whole list of the modules available to you in the documentation for Node.js. Since Node is so modular, you still have to require even the modules that are included in the core itself.
The module that we are going to put to good use for logging to the USB drive is the File System module, or fs for short. This module enables you to interact with, modify, add and remove files on your computer's file system (in this case your Tessel's).
The Concept
The functionality of this project can be explained as such. We want the Tessel 2 to do the following things:
- Create a
.csv(comma separated value) file on the USB drive. - Read the values from the sensors using Johnny-Five and store them locally as variables.
- Build a string that formats the values the way we would like them for easily importing into a spreadsheet.
- Append the
.csvfile with the logging string we created. - Rinse (set the string back to "") and repeat for the give
dataevent frequency!
First of all, let's head over to your terminal. In your working project directory, create a new JavaScript file called usbLog.js by entering the following command:
touch usbLog.js
The Code
You can now navigate to your new file in your text editor and copy and paste the following script into that file. Make sure you save after you have done that.
language:javascript
//require the file system module
var fileSys = require('fs');
//require the modules for hardware I/O
var five = require('johnny-five');
var t2 = require('tessel-io');

//create a new board object with io set to Tessel
var board = new five.Board({
  io: new t2()
});

//create a date object
var date = new Date();
//create a filePath string for location of USB drive.
var filePath = "/mnt/dev/sda0/" + String(date.now())+ '.csv';
//create a CSV header string to be added at the begining of the log.
var headerString = "Date,Air Temperature(F),Relative Humidity(%),Soil Moisture"
//create an empty logString
var logString = "";
//define the interval of logging in minutes, change this if you so choose.
const interval= 5;
//create a new file using the appendFileSync to keep things sychronous.
//create the variables for data as globals
var temp, humidity, moist;

//create the csv file with given path and append the header
fileSys.appendFileSync(filePath,headString,(error)=>{
  //if you get an error, log a message
  if(error){
     console.log('error setting up log file!');
  }
});

//when the board is ready...
board.on('ready', ()=>{
  //create a new multi object called atmos for the BME280
  var atmos = new five.Multi({
    controller: 'BME280',
    freq: (interval*60000)
  });

  //when atmos gets 'data'...
  atmos.on('data', ()=>{
    //store temperature and humidity
    temp = this.thermometer.fahrenheit;
    humidity = this.hygometer.relativeHumidity;

    logString = date.toISOString()+','+temp+','+humidity+','+moisture+'\n'
  //append the log file with the logString
  fileSys.appendFileSync(filePath,logSting,(error)=>{
     //if error, log message
     if(error){
      console.log('error logging to file!');
    }
    //else reset the logString to blank
    else{
      logString = '';
    }
  });
  });

});
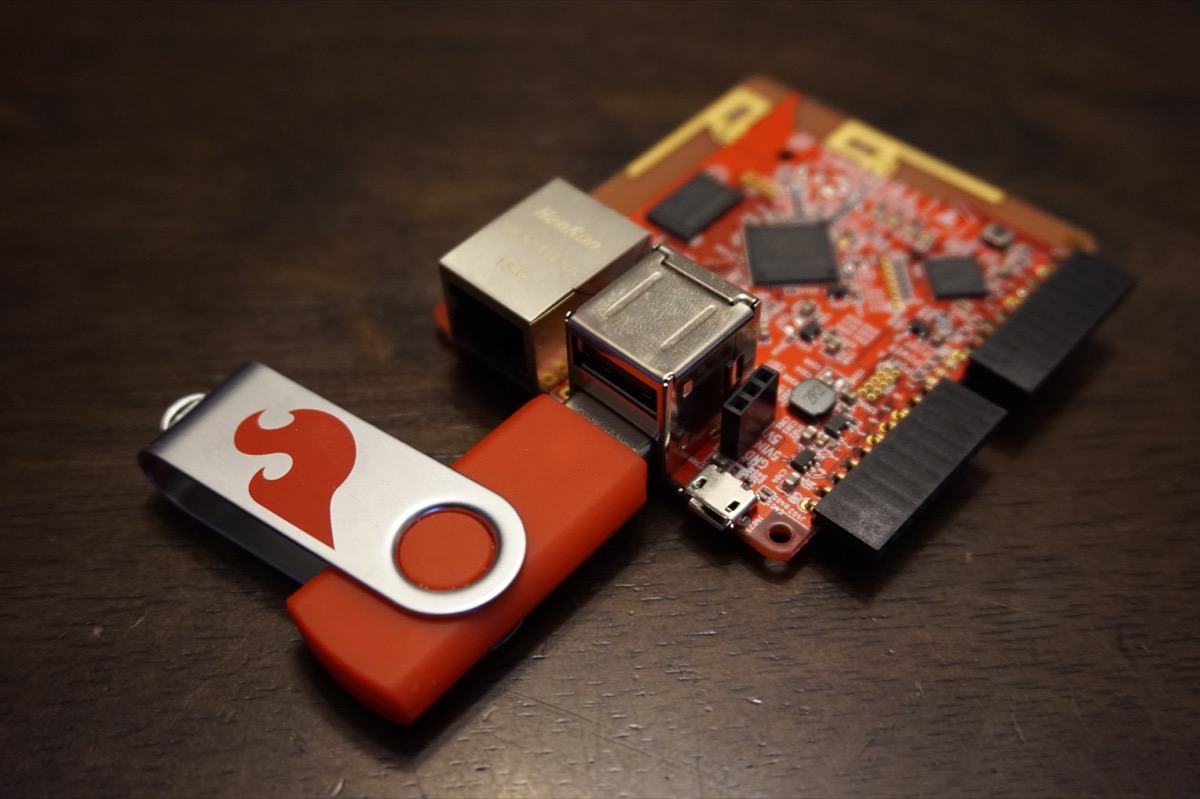
Save your script, and insert your USB Thumb drive into a USB port in your Tessel 2. We recommend using the top USB drive because there are a number of thumb drives that may be wide enough to block the micro USB port you need to power the board, but your USB may work in the bottom one just fine. It doesn't change how anything functions.
Once you have inserted your USB thumb drive and saved your script as usbLog.js, go ahead and deploy your code to your Tessel by running the following command in your console:
t2 run usbLog.js
Let the script run for a while while putting your finger over the BME280.
The Tessel will log values once every five minutes, so let it run for a good long while. Eat a cookie, read a magazine, lie back and relax while the Tessel does all of the work. Or you can change the logging interval for testing purposes.
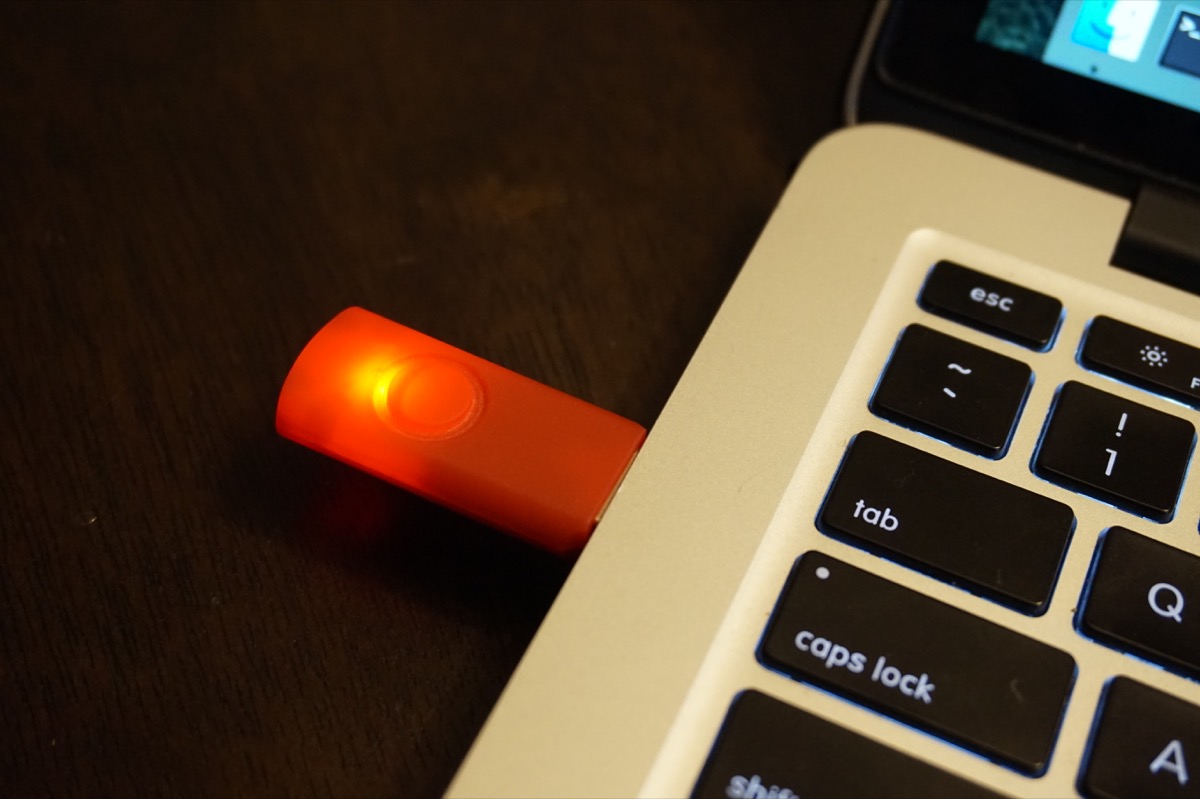
Once you can't stand it anymore and you want to get your hands on your data, go ahead and remove the USB storage device from the Tessel, and insert it into a computer.
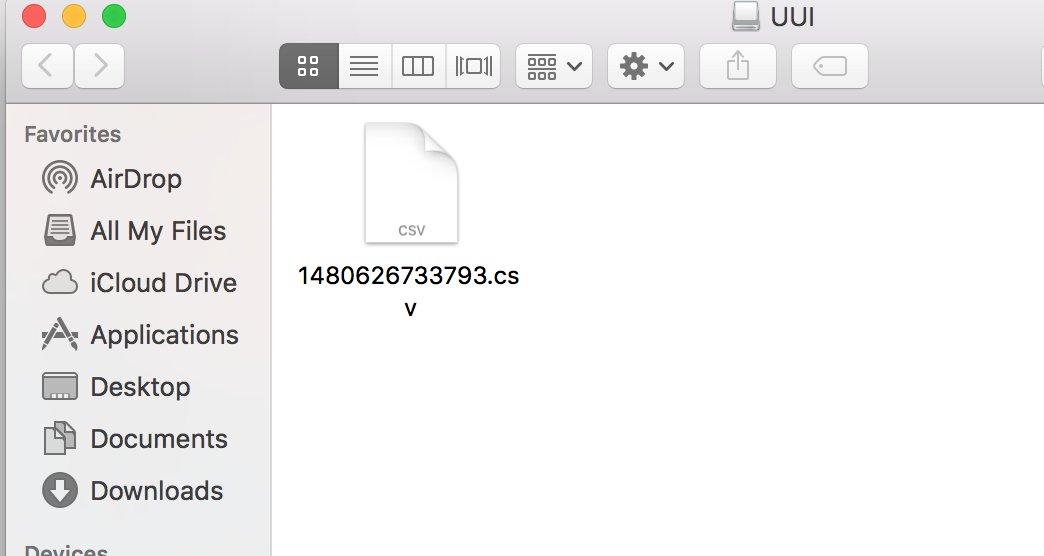
An external drive should become visible; go ahead and open it. You should be greeted with a single file on your device, which should have a name of a very long number with a file extension of .csv. Open the file, and it should contain your data in CSV format!
With that you are ready to import the data into your Google Sheets file, but let's pause for a bit and dive into what makes this code work!
Code to Note
Before we move on to the Google Sheets portion of this project, let's take a deeper look into the code and how this was accomplished using Node.js and Johnny-Five.
language:javascript
var fileSys = require('fs');
Node.js is super modular; to do even simple things, many times you have to include native modules that come with Node.js. File System, or fs, is one of those modules. It is used any time you want to use other files in conjunture with your node project.
language:javascript
var five = require('johnny-five');
var t2 = require('tessel-io');

//create a new board object with io set to Tessel
var board = new five.Board({
  io: new t2()
});
When using Johnny-Five with single board computers (SBCs) you have to install and require a secondary module for working with that specific SBC's I/O pins. In this case we are working with the Tessel 2, so we need to require the tessel-io module that we installed during setup. Then, when we create a board object, we specify the io of the board as a new t2().
language:javascript
var date = new Date();
If you have used any JavaScript before, you may be familiar with the Date object. We use it in this script to create a time stamp for our data, and even the log file name is based off of now() method, which retrieves the number of seconds since January 1, 1970, 00:00:00 UTC. Most importantly we use the toISOString() method to produce a user-friendly time and date stamp for our data-logging string.
language:javascript
fileSys.appendFileSync(filePath,headString,(error)=>{
  //if you get an error, log a message
  if(error){
     console.log('error setting up logging file!');
  }
});
To write data to the log file, we use the appendFileSync() method of the fs module. This takes two arguments: the first is the file path to the file you want to append (or add to), and the second is the data you want to append to the file as a string. You can find out more about the method and the differences between the synchronous and asynchronous versions of the method in the fs documentation.
We use this method twice! The first time writes the .csv header to the file at the very beginning of the script. Later we use it inside of the setInterval() function to log the individual lines of data every five minutes.
language:javascript
  //when atmos gets 'data'...
  atmos.on('data', ()=>{
    //store temperature and humidity
    temp = this.thermometer.fahrenheit;
    humidity = this.hygometer.relativeHumidity;

    logString = date.toISOString()+','+temp+','+humidity+','+moisture+'\n'
  //append the log file with the logString
  fileSys.appendFileSync(filePath,logSting,(error)=>{
     //if error, log message
     if(error){
      console.log('error logging to file!');
    }
    //else reset the logString to blank
    else{
      logString = '';
    }
  });
  });
Each sensor object has an event attached to it. In this case we are using the 'data' event. This event happens at a given time interval, which is controlled by the freq option in the board setup. In this case we set freq: (interval*60000). So, every five minutes or 5*60000 milliseconds the 'data' event gets called. When the data event is received by the sensor object, the event is triggered, and we then store the sensor values in the variables temp and humidity.
Every five minutes a new string gets built by concatenating the date string and the data points from the two variables, which are then terminated with a newline character (\n).
The string is then appended to the file, and, if there is no error in the process, the logString is reset to a blank string. This is then repeated every five minutes.
Getting the Data into Sheets
Now we have data in not so user-friendly CSV format ... now what? Google Sheets to the rescue! If you have been under a rock for the past 10 years and haven't heard that Google has an online suite of office tools at your disposal, today is the day we rectify that problem. The spreadsheet program is called "Sheets."
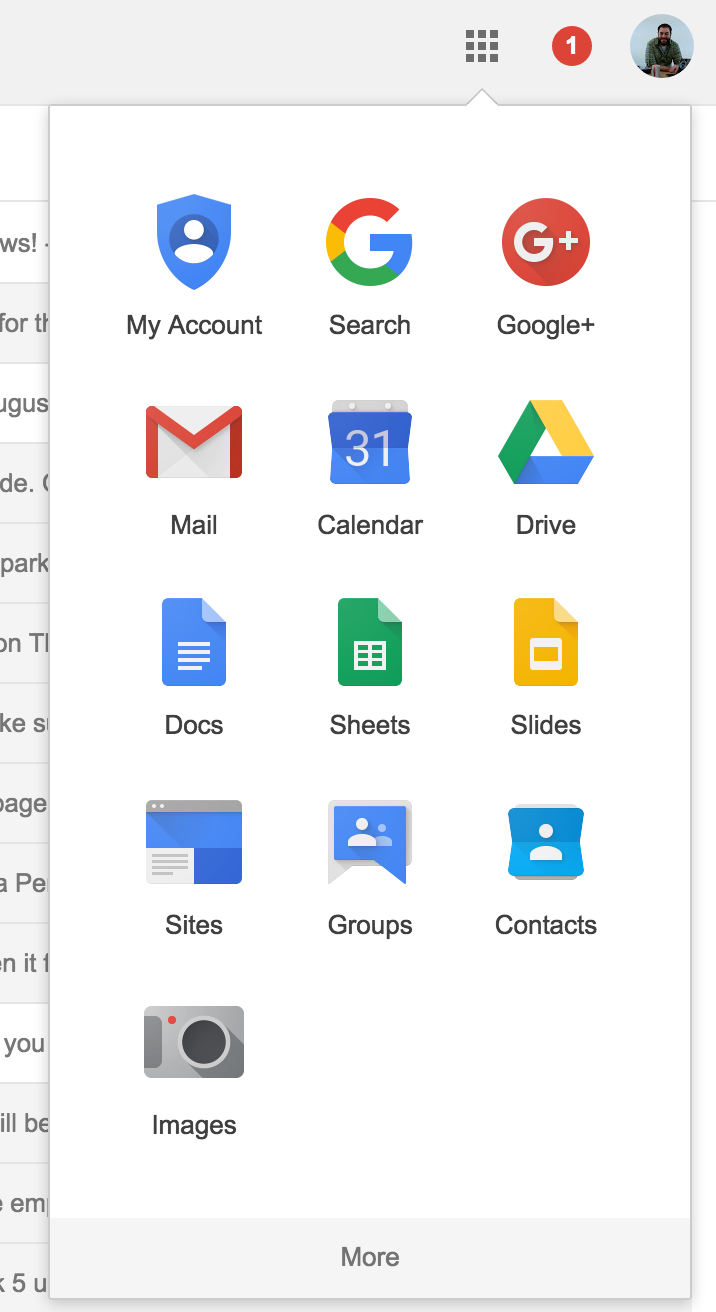
If you don't have a Google account, no problem. It's easy to sign up for one, and it's free! Once you are signed in to your Google account, click on the apps icon, which is the little grid of squares in the upper righthand corner. Select Sheets from that list.

From there, you will be greeted with a number of options for what to do in Sheets. You want to just create a blank sheet for now. Click on "blank" once in the program.
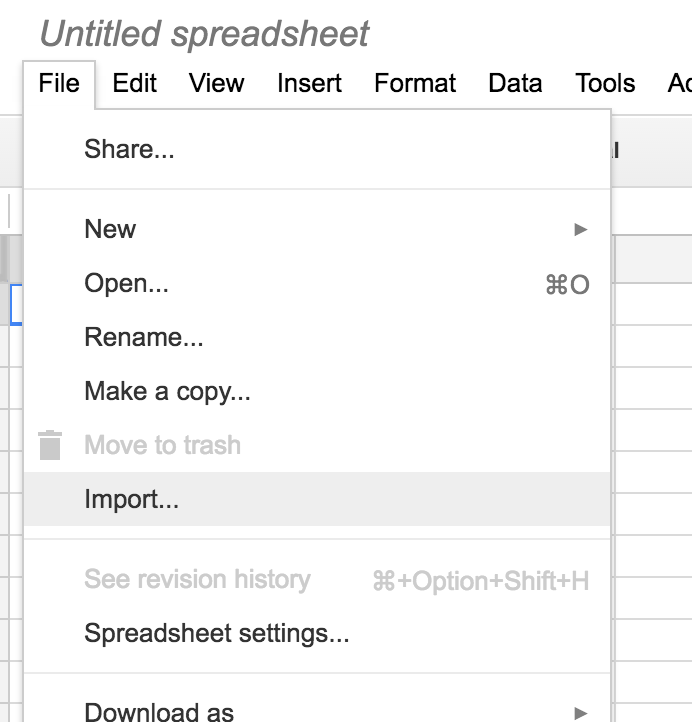
A new Sheets project will open. Select _File > Import..._. This will bring up a dialog box that you will need to use to navigate to your external USB drive and the .csv file that is on it. Select the file, and click _Open_.

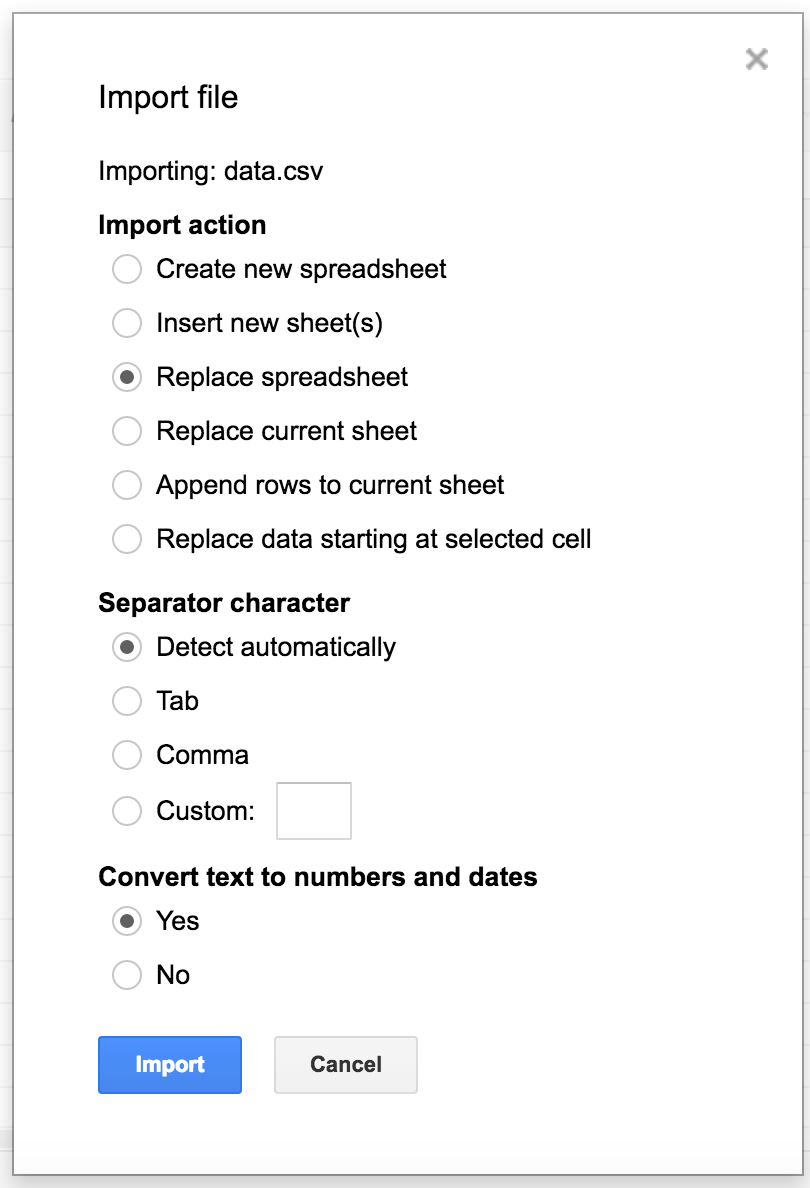
From there you will get a slew of options about how you would like to import the data. We actually preformatted the data when we collected it, so this is all done. Go ahead and click through this window.
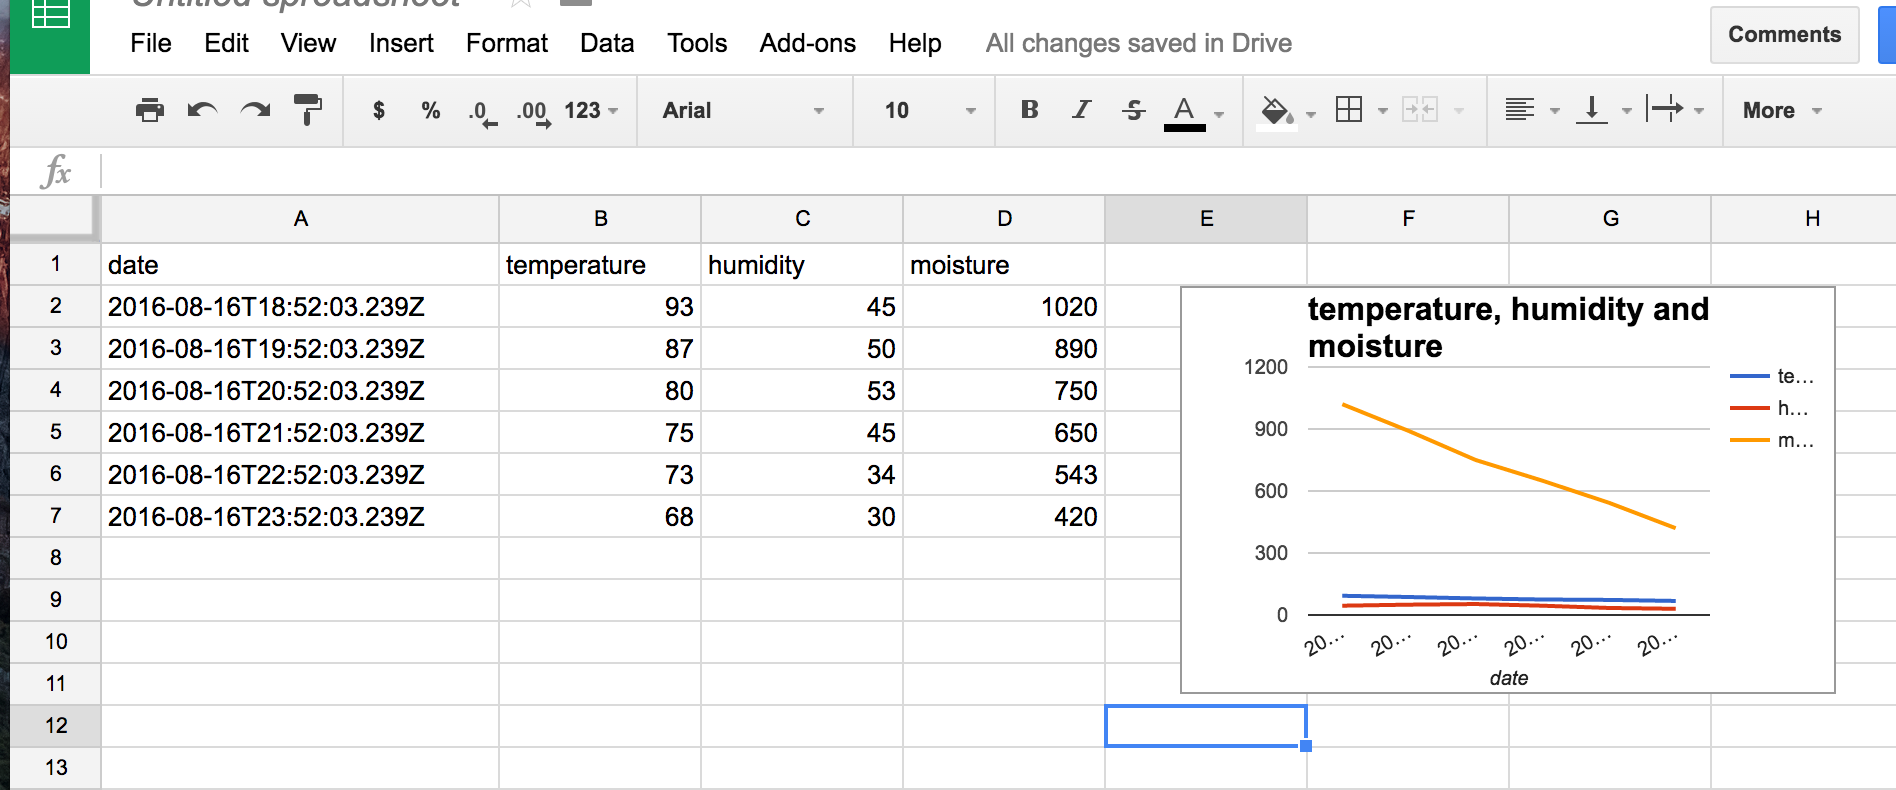
Your data will now appear as a sheet as shown! Wahoo, data in a table!

From here, it is a few simple steps to building a graph.
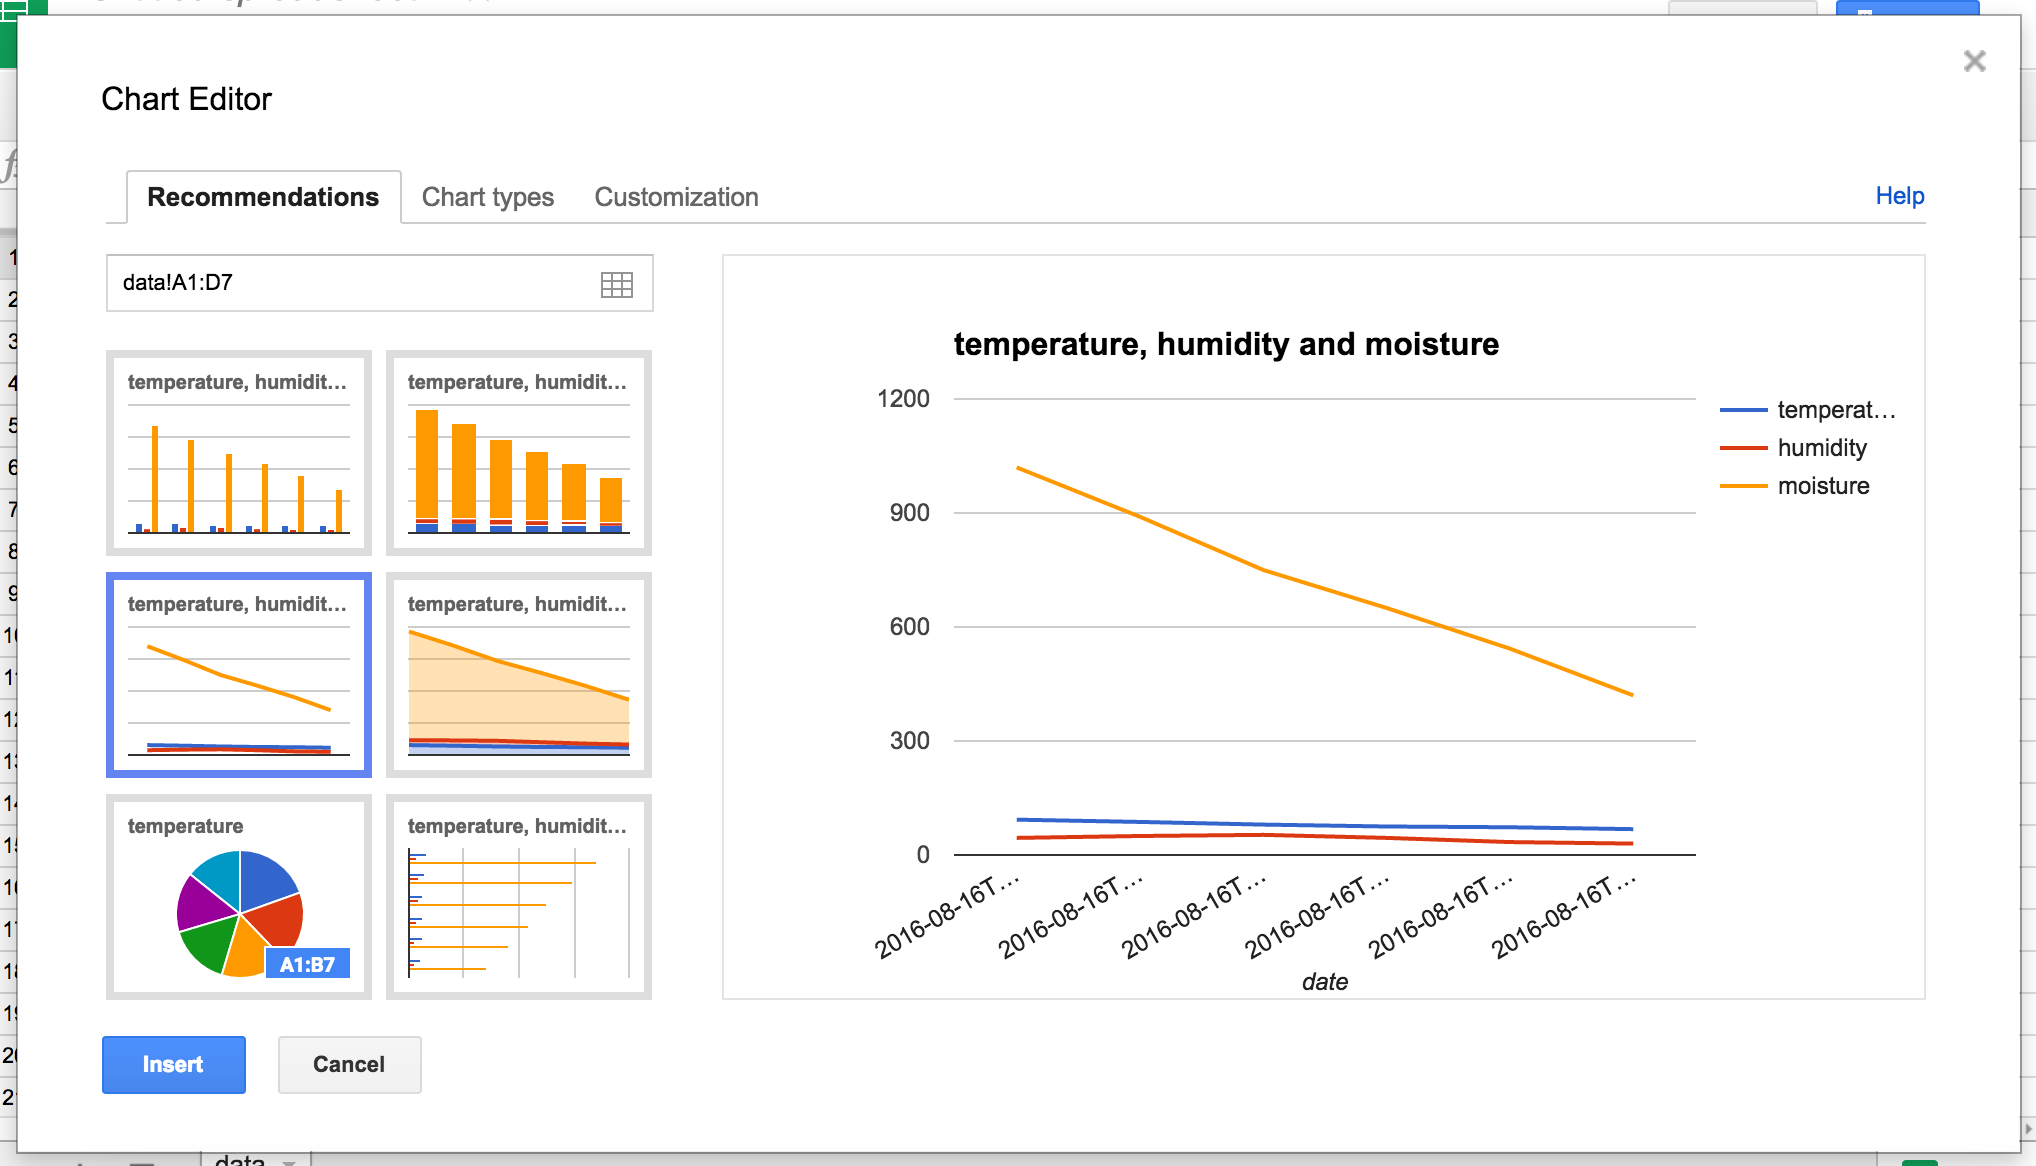
Using your cursor, select the Create Graph button, and it will bring up the graph options. You can select your graph type, and it will give you a preview of what it will look like. I selected a line graph:
Once you are happy with your graph selection, accept your graph. It will then show up in your sheet, where you can move it around and resize it.
With that you are done! You can do all sorts of further calculations and other graphs using Sheets. Or if there is something that you are missing and you'd prefer to use Microsoft Excel or another Office tool chain, feel free; they are all about as simple to import data into. The downside of doing this is that you have to make a new sheet or copy and paste data into this one every time you want to update it. This is where IFTTT comes into play!