Getting Started with Machinechat
Contributors:
Ell C
Displaying Data
Now we get to do the fun stuff!
Go to Data Dashboard, and click on the Orange ADD CHART Button.
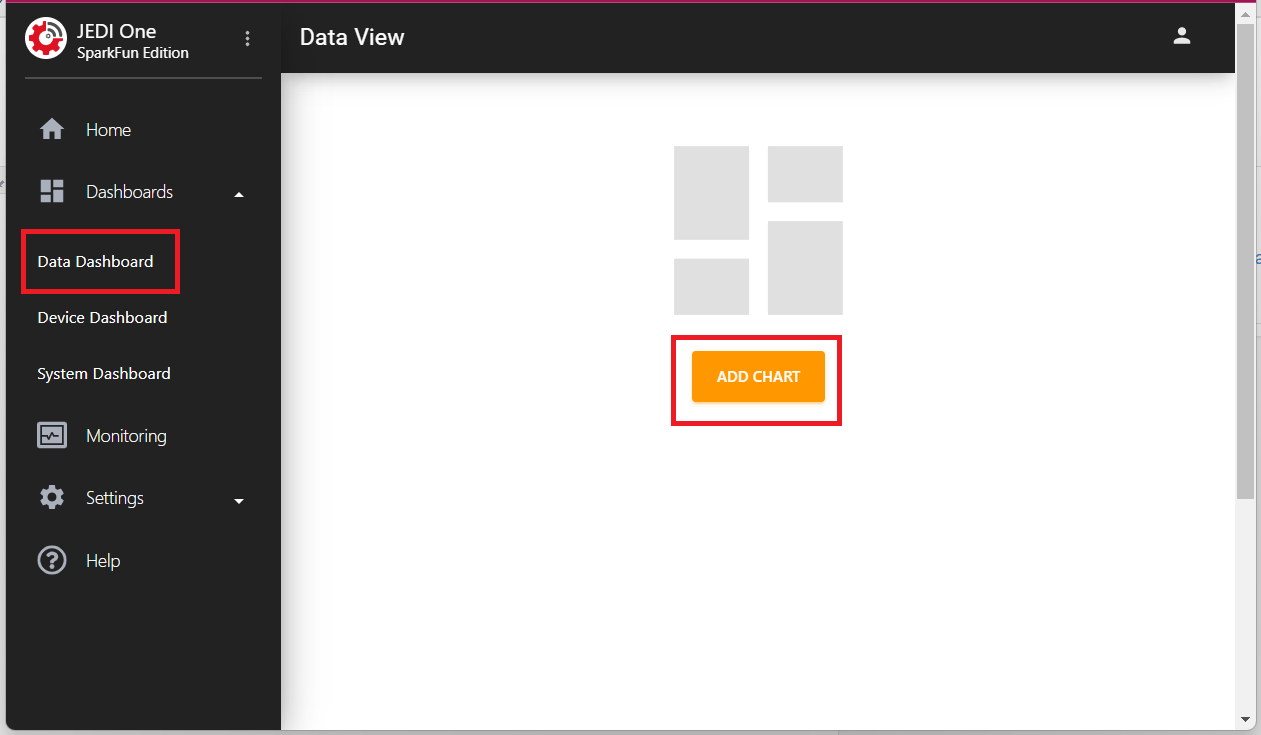
Having a hard time seeing the details? Click the image for a closer look.
Go ahead and fill in as you see fit. You'll need to click on the green plus button to add a Data Source:
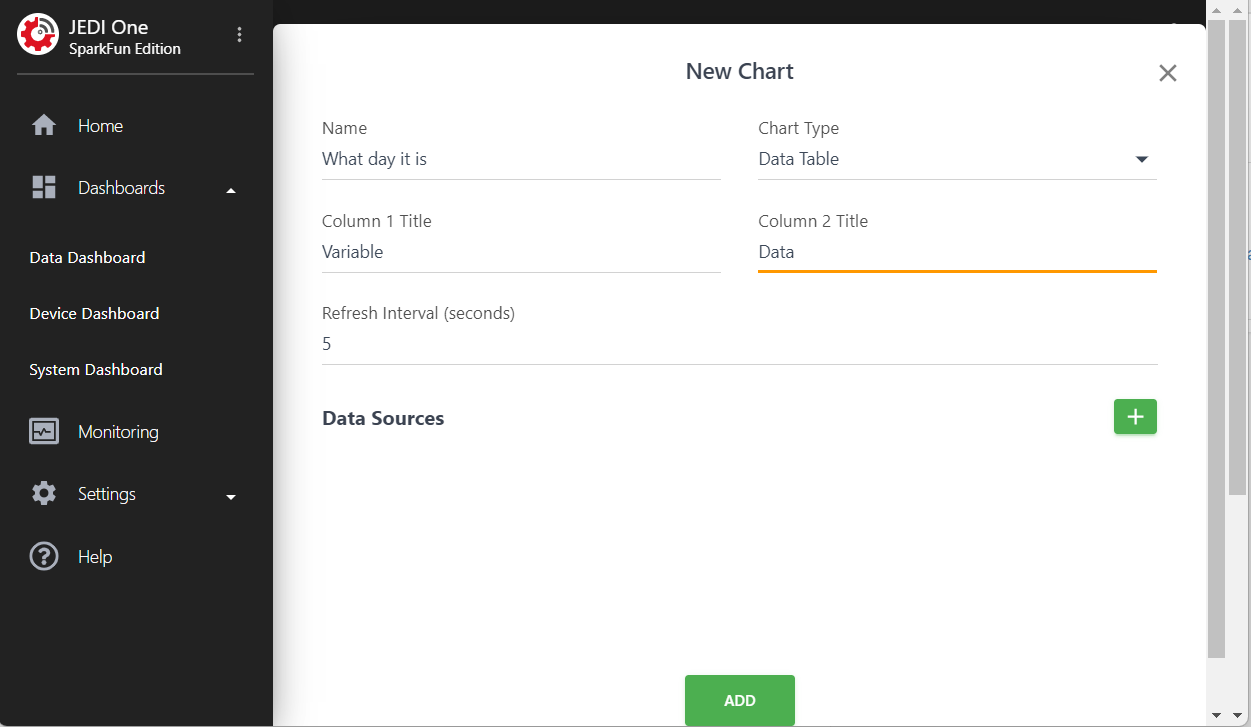
Having a hard time seeing the details? Click the image for a closer look.
Click on the Green Plus button to the right of Data Sources to add your Data Source for your Data Table and then click ADD:
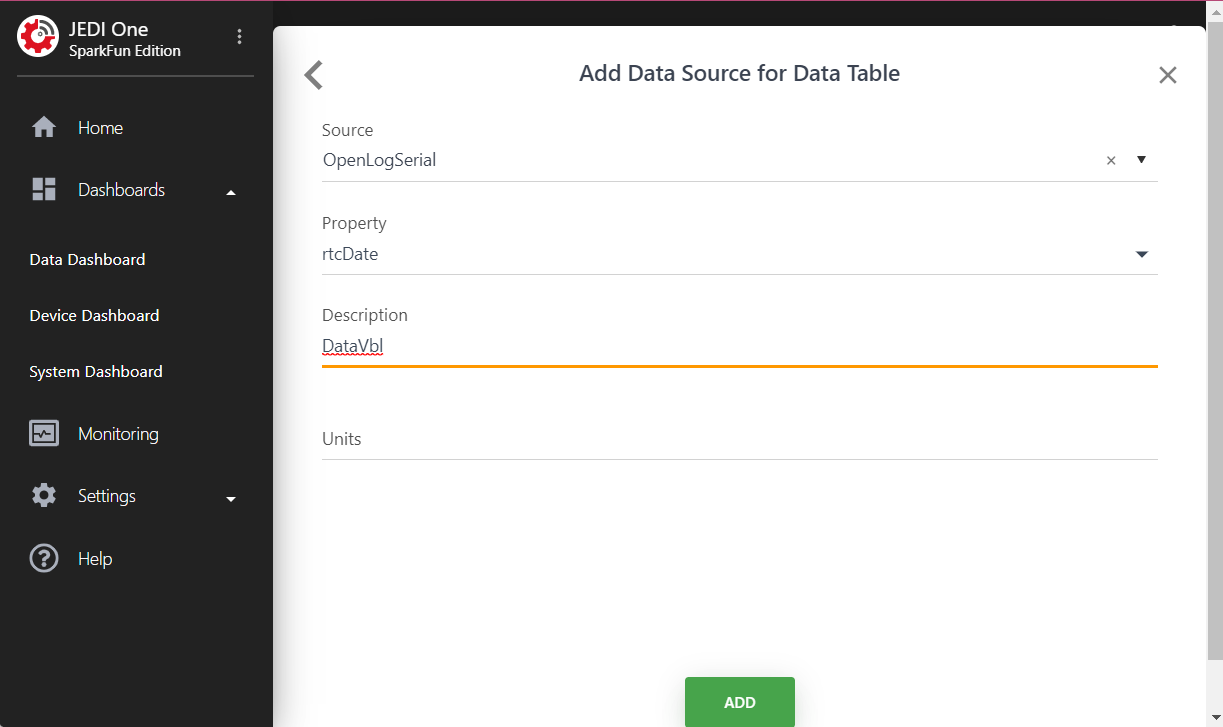
Having a hard time seeing the details? Click the image for a closer look.
Make sure you've got this page filled out to your satisfaction, and then click the green "ADD" button.
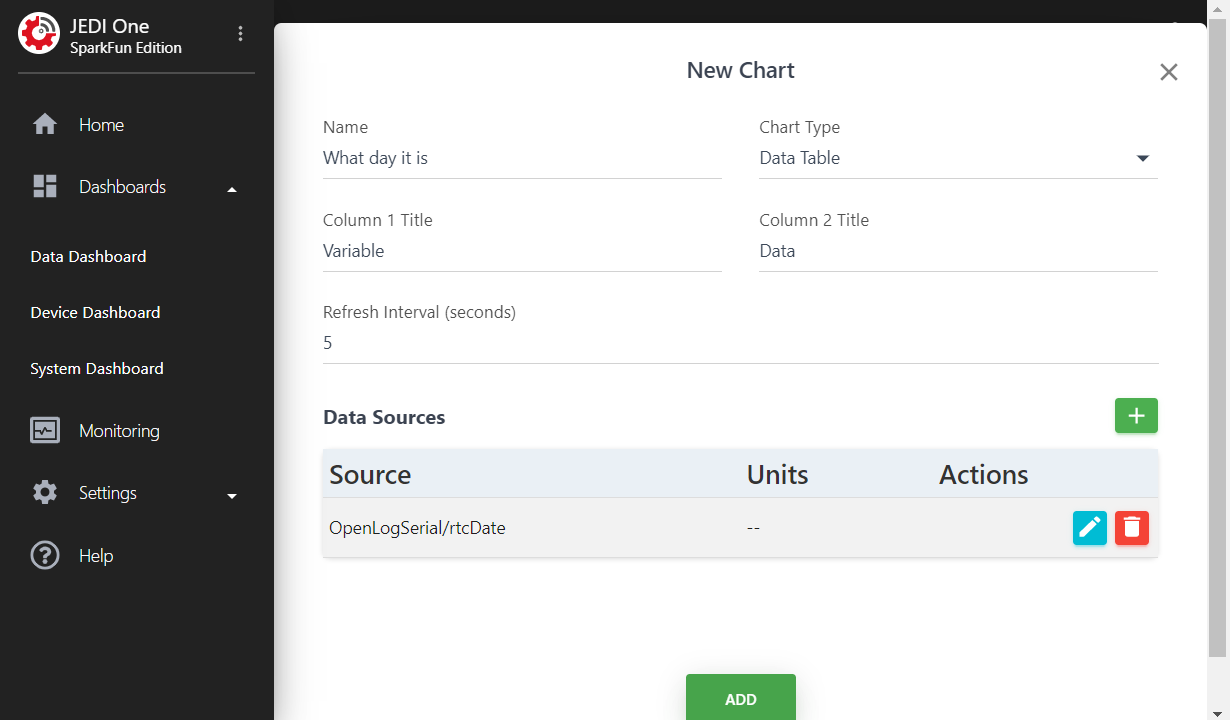
Having a hard time seeing the details? Click the image for a closer look.
Aaaaand VOILA!
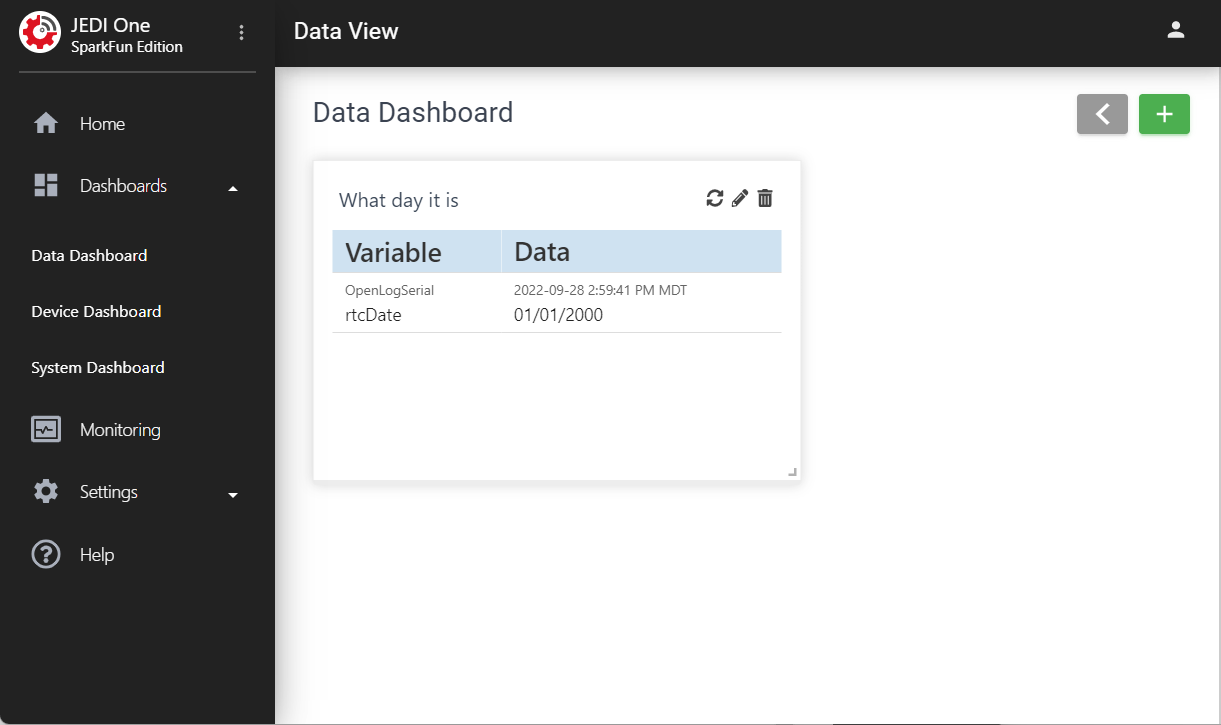
Having a hard time seeing the details? Click the image for a closer look.
Take some time to poke around - you can add charts and data as you see fit - including data from Qwiic breakout boards. Here's a System Dashboard with some of the data from our Environmental and Air Quality sensors:
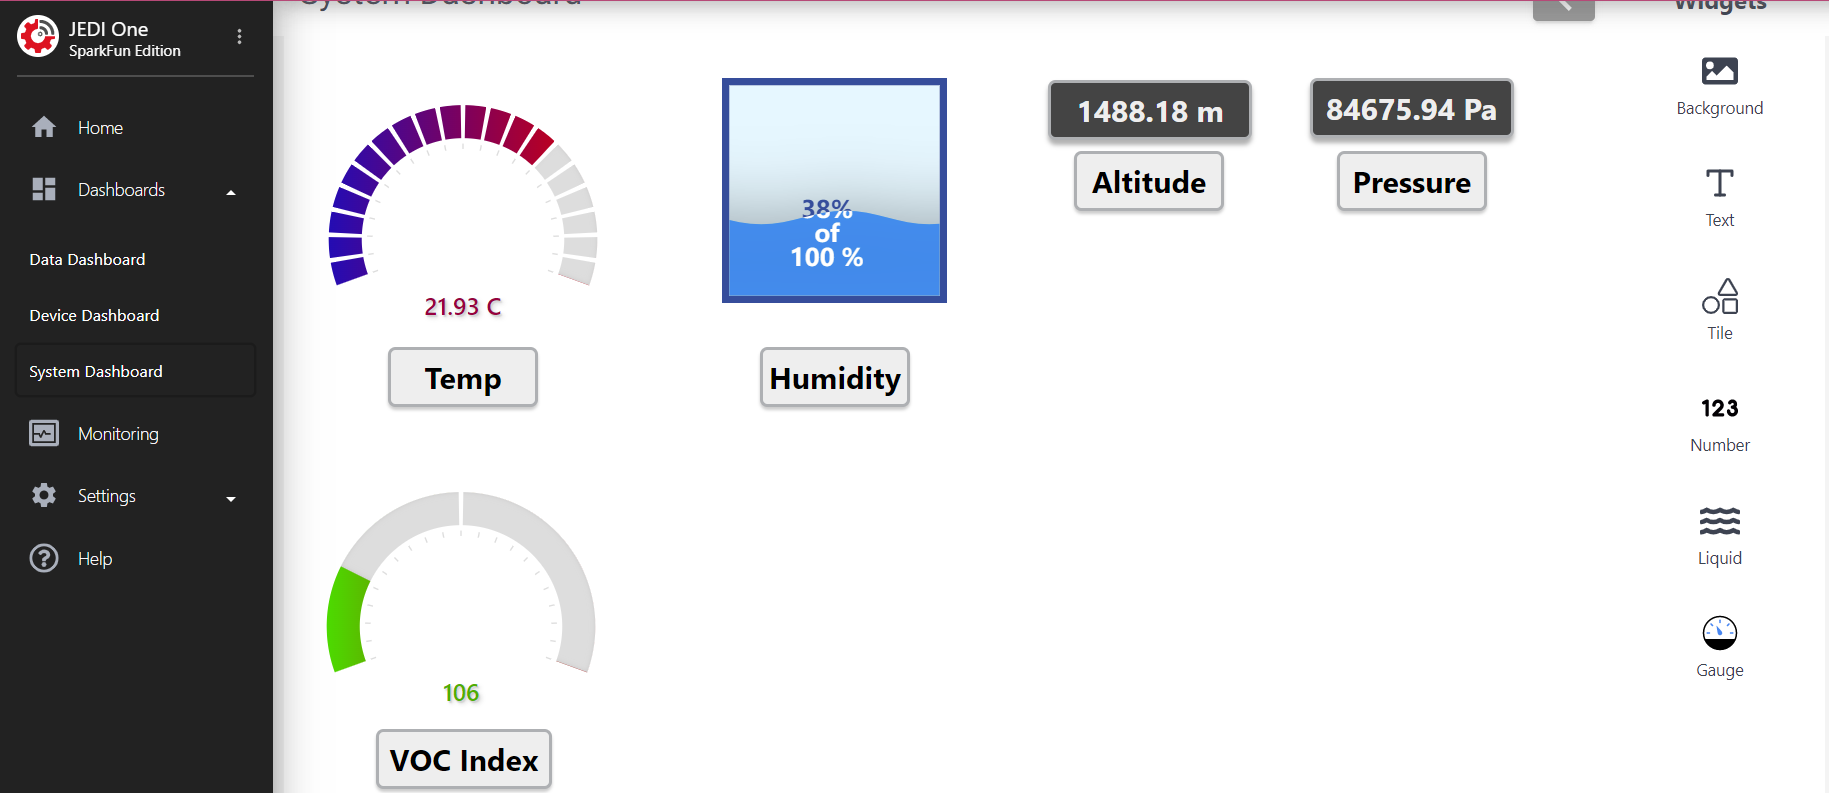
Having a hard time seeing the details? Click the image for a closer look.