Getting Started with Machinechat
Configuring Your Dashboard
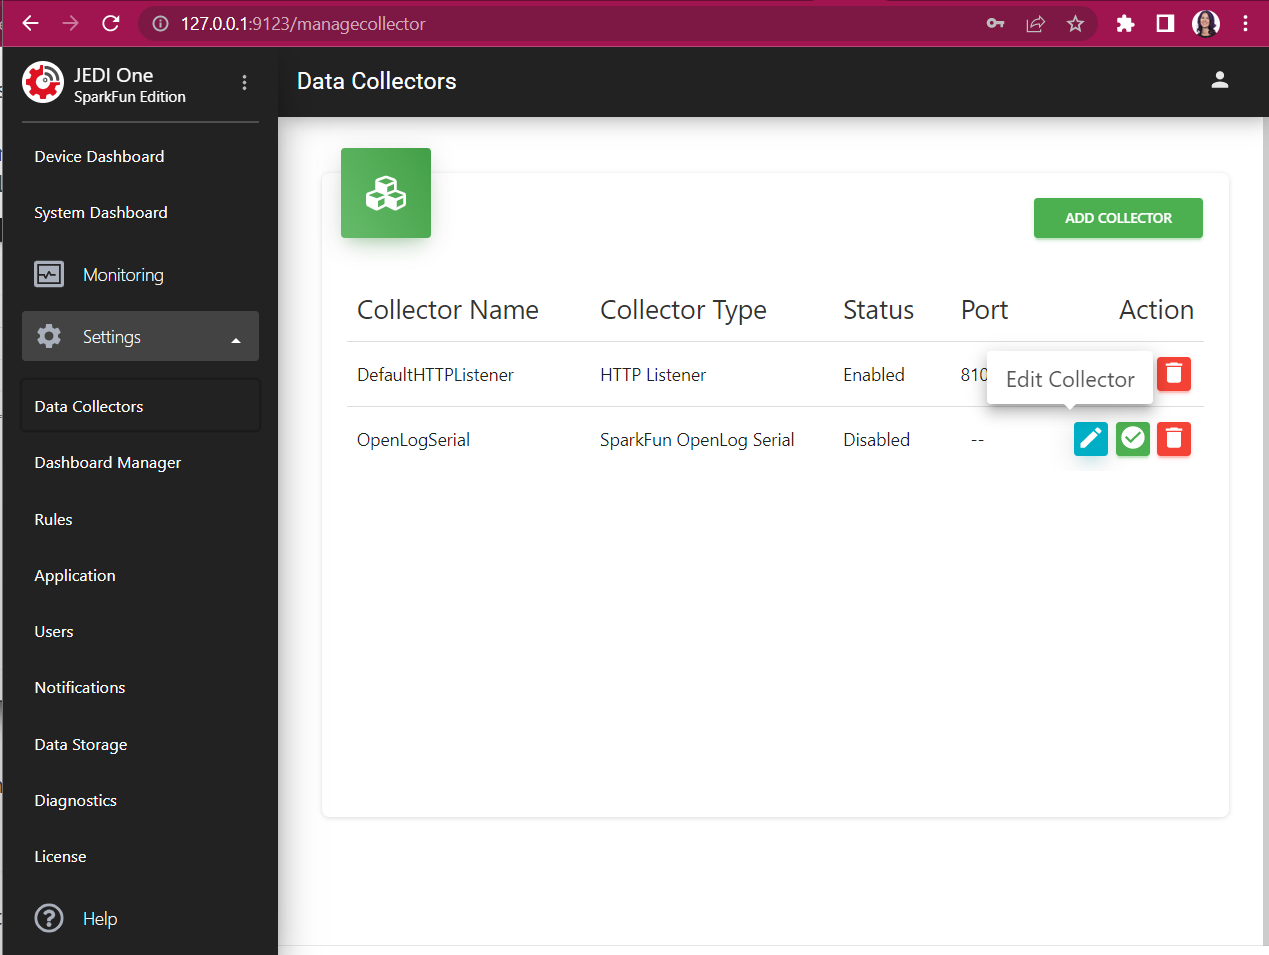
Once you're logged into Machine chat, you should be able to click on Settings -> Data Collectors and the OpenLogSerial will be listed. Go ahead and click on that Edit Collector button.
You may need to change some settings - verify that you've got the correct Serial Port selected, and set the rest of the settings as so:
- Baud Rate (115200)
- Data Bits (8)
- Parity (No parity)
- Stop Bits (One Stop Bit)
- Record Delimiter (Newline)
- Time Stamp at Server
- Is After Line (selected) and text entry should be Content-Type: text/csv.
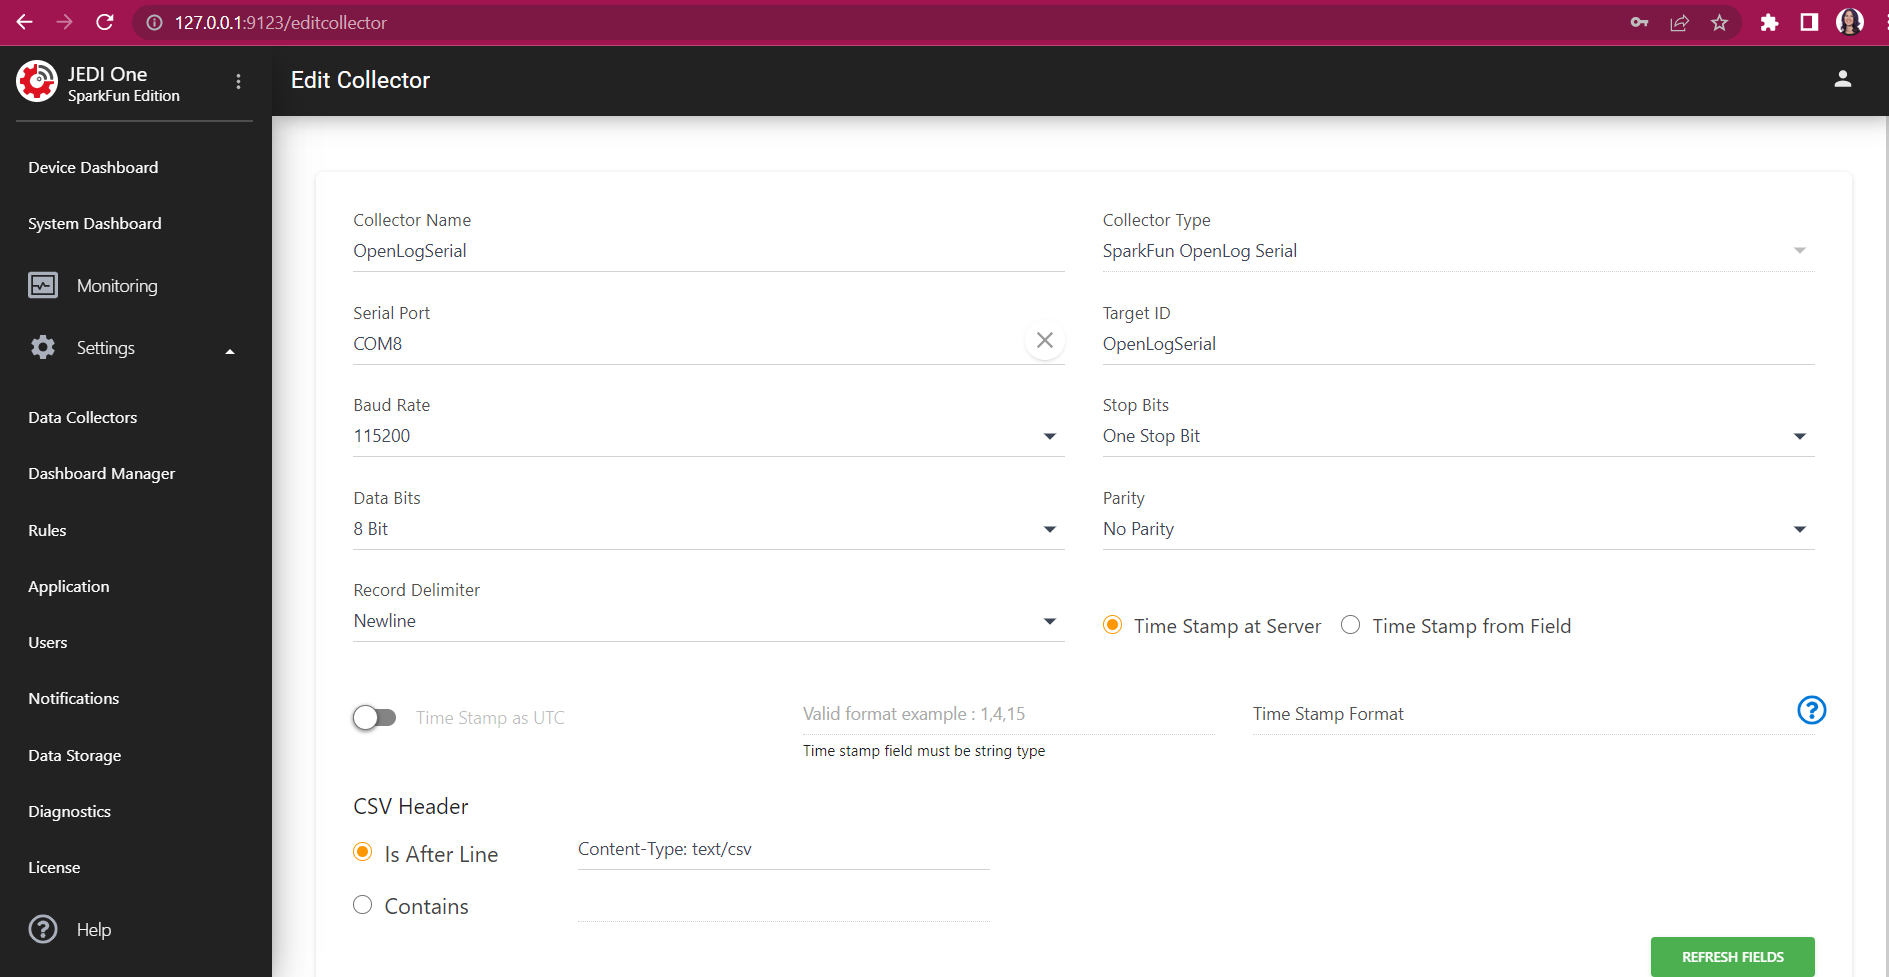
Once you've checked all the above, go ahead and click Save at the bottom of the page.
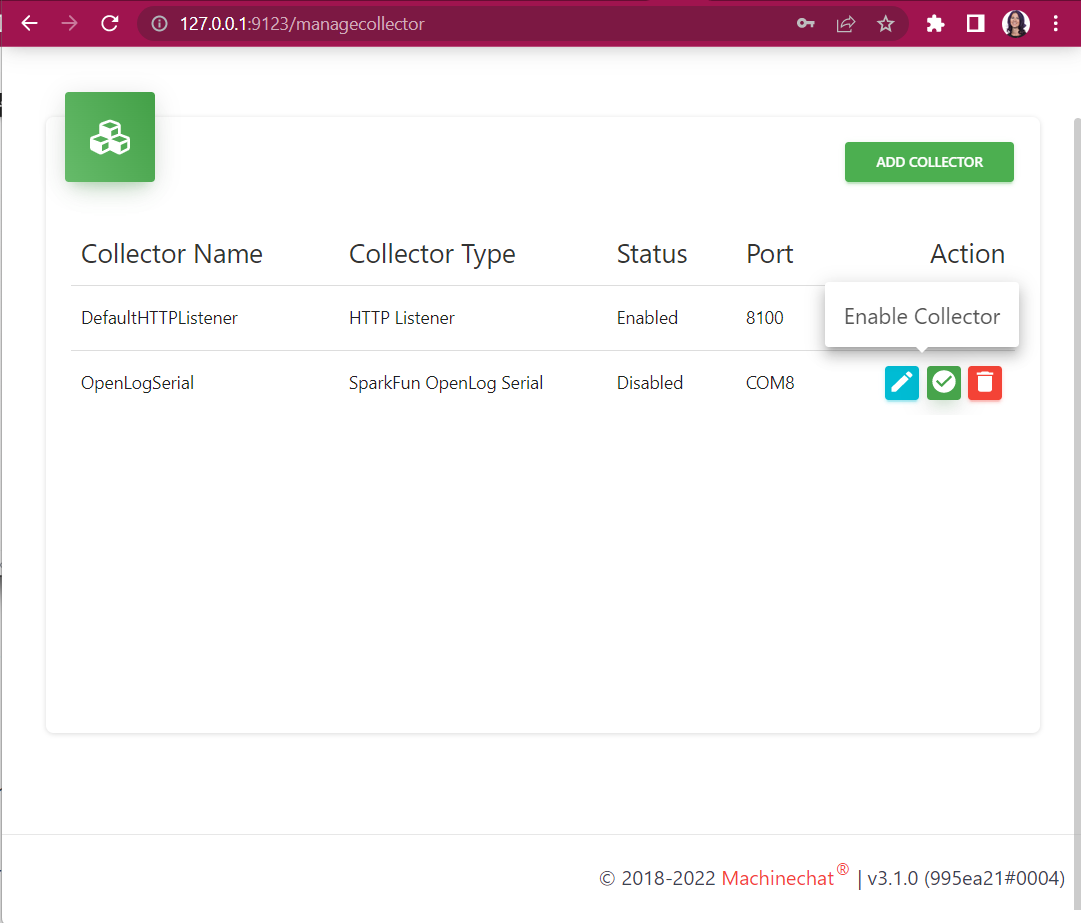
You'll be redirected back to the Data Collectors page; if the OpenLog Collector is disabled, click on the green Enable Collector icon.
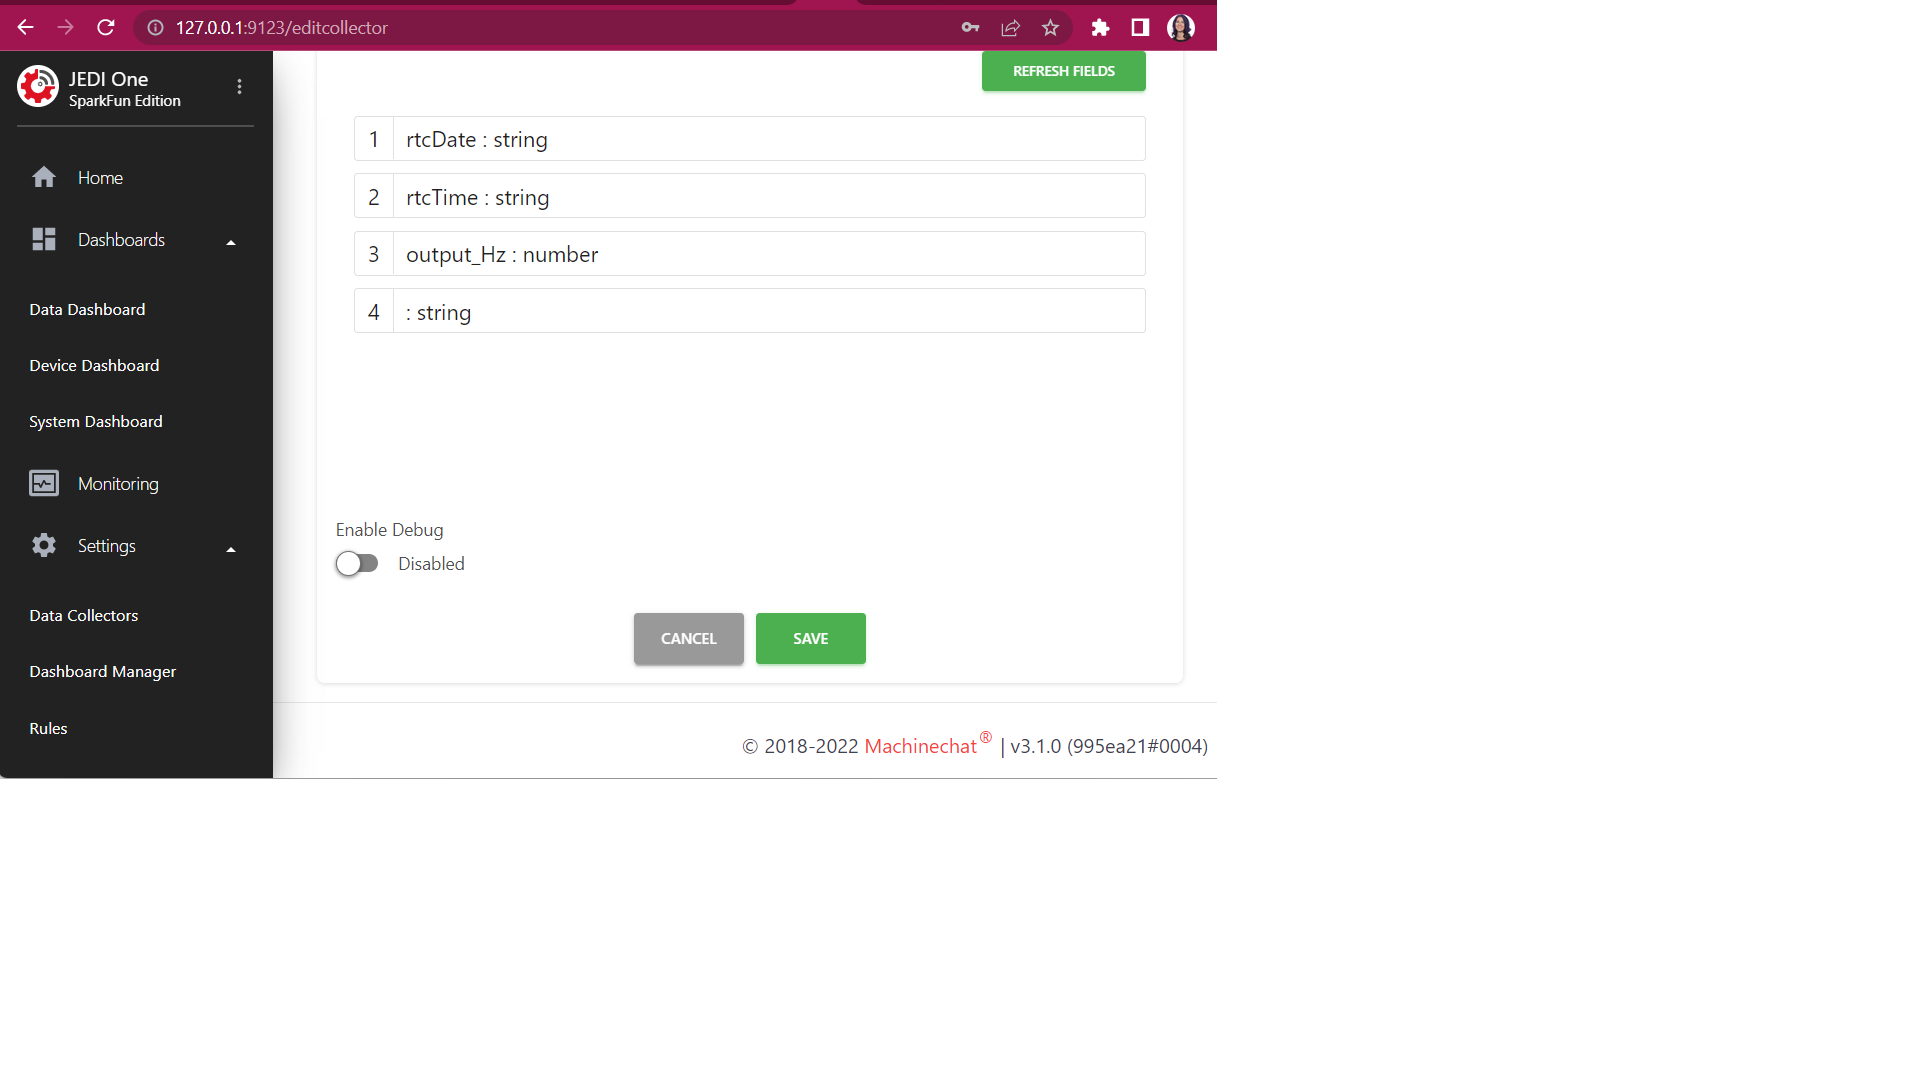
If you click the Edit Collector button again, you should be able to scroll down and see the variables and data that are being collected from the OpenLog Artemis. These are the variables we'll use to create dashboard views!