Python GUI Guide: Introduction to Tkinter
 Shawn Hymel
Experiment 3: Sensor Dashboard
In this next experiment, we're going to connect a couple of I2C sensors and display their information in real time on our monitor. We start by just showing the sensor's numerical values and then bring in Matplotlib to create a live updating graph of that data. Note that these are just example sensors; feel free to use whatever sensors you'd like for your particular application.
Hardware Connections
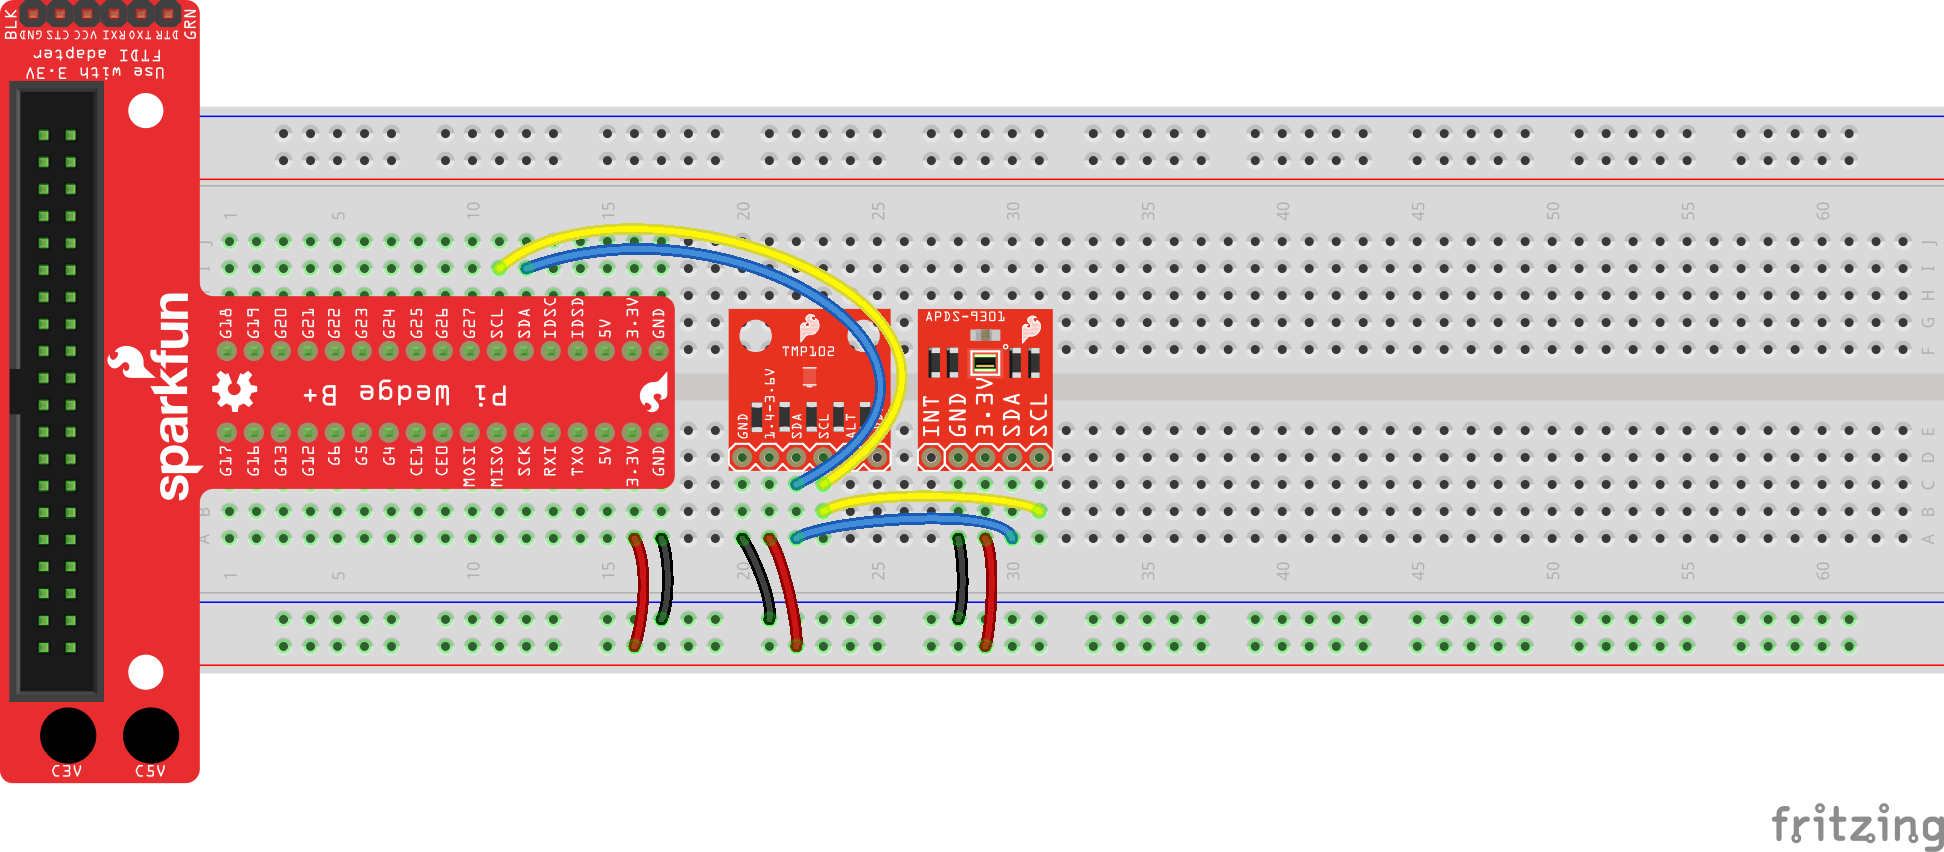
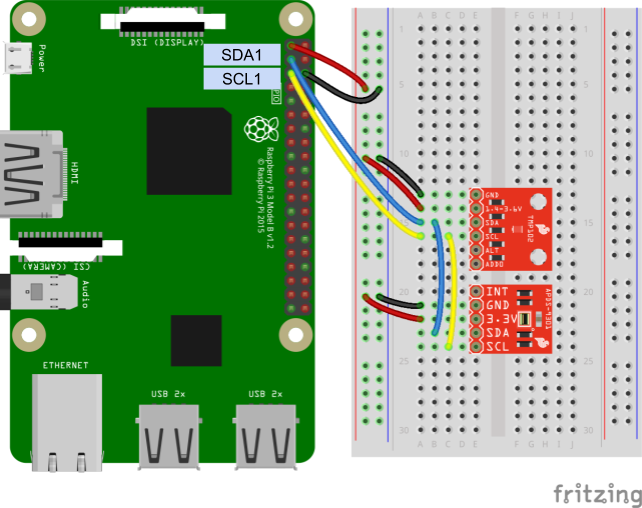
Connect a TMP102 Temperature Sensor breakout and APDS-9301 Ambient Light Sensor breakout to the Raspberry Pi as shown in the diagrams below.
Connecting through a Pi Wedge:
Connecting directly to the Raspberry Pi:
Sensor Modules
To simplify our I2C reading and writing, we're going to copy in Python modules to read data from the TMP102 and APDS-9301 sensors. Open a new file named tmp102.py:
language:bash
nano tmp102.py
Copy in the following Python code:
language:python
import smbus

# Module variables
i2c_ch = 1
bus = None

# TMP102 address on the I2C bus
i2c_address = 0x48

# Register addresses
reg_temp = 0x00
reg_config = 0x01

# Calculate the 2's complement of a number
def twos_comp(val, bits):
    if (val & (1 << (bits - 1))) != 0:
        val = val - (1 << bits)
    return val

# Read temperature registers and calculate Celsius
def read_temp():

    global bus

    # Read temperature registers
    val = bus.read_i2c_block_data(i2c_address, reg_temp, 2)
    temp_c = (val[0] << 4) | (val[1] >> 4)

    # Convert to 2s complement (temperatures can be negative)
    temp_c = twos_comp(temp_c, 12)

    # Convert registers value to temperature (C)
    temp_c = temp_c * 0.0625

    return temp_c

# Initialize communications with the TMP102
def init():

    global bus

    # Initialize I2C (SMBus)
    bus = smbus.SMBus(i2c_ch)

    # Read the CONFIG register (2 bytes)
    val = bus.read_i2c_block_data(i2c_address, reg_config, 2)

    # Set to 4 Hz sampling (CR1, CR0 = 0b10)
    val[1] = val[1] & 0b00111111
    val[1] = val[1] | (0b10 << 6)

    # Write 4 Hz sampling back to CONFIG
    bus.write_i2c_block_data(i2c_address, reg_config, val)

    # Read CONFIG to verify that we changed it
    val = bus.read_i2c_block_data(i2c_address, reg_config, 2)
Save the code with ctrl + x, press y, and press enter. This module allows us to call init() and read_temp() functions to initialize and read temperature data from the TMP102.
Similarly, we need to create a module for our APDS-9301. Create a new file named apds9301.py:
language:bash
nano apds9301.py
Copy in the following code:
language:python
import smbus

# Module variables
i2c_ch = 1
bus = None

# APDS-9301 address on the I2C bus
apds9301_addr = 0x39

# Register addresses
apds9301_control_reg = 0x80
apds9301_timing_reg = 0x81
apds9301_data0low_reg = 0x8C
apds9301_data1low_reg = 0x8E

# Initialize communications and turn on the APDS-9301
def init():

    global bus

    # Initialize I2C (SMBus)
    bus = smbus.SMBus(i2c_ch)

    # Read the CONTROL register (1 byte)
    val = bus.read_i2c_block_data(apds9301_addr, apds9301_control_reg, 1)

    # Set POWER to on in the CONTROL register
    val[0] = val[0] & 0b11111100
    val[0] = val[0] | 0b11

    # Enable the APDS-9301 by writing back to CONTROL register
    bus.write_i2c_block_data(apds9301_addr, apds9301_control_reg, val)

# Read light data from sensor and calculate lux
def read_lux():

    global bus

    # Read channel 0 light value and combine 2 bytes into 1 number
    val = bus.read_i2c_block_data(apds9301_addr, apds9301_data0low_reg, 2)
    ch0 = (val[1] << 8) | val[0]

    # Read channel 1 light value and combine 2 bytes into 1 number
    val = bus.read_i2c_block_data(apds9301_addr, apds9301_data1low_reg, 2)
    ch1 = (val[1] << 8) | val[0]

    # Make sure we don't divide by 0
    if ch0 == 0.0:
        return 0.0

    # Calculate ratio of ch1 and ch0
    ratio = ch1 / ch0

    # Assume we are using the default 13.7 ms integration time on the sensor
    # So, scale raw light values by 1/0.034 as per the datasheet
    ch0 *= 1 / 0.034
    ch1 *= 1 / 0.034

    # Assume we are using the default low gain setting
    # So, scale raw light values by 16 as per the datasheet
    ch0 *= 16;
    ch1 *= 16;

    # Calculate lux based on the ratio as per the datasheet
    if ratio <= 0.5:
        return (0.0304 * ch0) - ((0.062 * ch0) * ((ch1/ch0) ** 1.4))
    elif ratio <= 0.61:
        return (0.0224 * ch0) - (0.031 * ch1)
    elif ratio <= 0.8:
        return (0.0128 * ch0) - (0.0153 * ch1)
    elif ratio <= 1.3:
        return (0.00146 * ch0) - (0.00112*ch1)
    else:
        return 0.0
Save and exit with ctrl + x, y, and enter. Like our tmp102 module, we can call init() and read_lux() to initialize and read the ambient light values from the APDS-9301 sensor.
Code Part 1: Fullscreen Numerical Dashboard
Let's start by making a simple display that takes up the full screen and shows the numerical temperature and ambient light values. Copy the following code into a new file:
language:python
import tkinter as tk
import tkinter.font as tkFont

import tmp102
import apds9301

###############################################################################
# Parameters and global variables

# Declare global variables
root = None
dfont = None
frame = None
temp_c = None
lux = None

# Global variable to remember if we are fullscreen or windowed
fullscreen = False

###############################################################################
# Functions

# Toggle fullscreen
def toggle_fullscreen(event=None):

    global root
    global fullscreen

    # Toggle between fullscreen and windowed modes
    fullscreen = not fullscreen
    root.attributes('-fullscreen', fullscreen)
    resize()

# Return to windowed mode
def end_fullscreen(event=None):

    global root
    global fullscreen

    # Turn off fullscreen mode
    fullscreen = False
    root.attributes('-fullscreen', False)
    resize()

# Automatically resize font size based on window size
def resize(event=None):

    global dfont
    global frame

    # Resize font based on frame height (minimum size of 12)
    # Use negative number for "pixels" instead of "points"
    new_size = -max(12, int((frame.winfo_height() / 10)))
    dfont.configure(size=new_size)

# Read values from the sensors at regular intervals
def poll():

    global root
    global temp_c
    global lux

    # Update labels to display temperature and light values
    try:
        val = round(tmp102.read_temp(), 2)
        temp_c.set(val)
        val = round(apds9301.read_lux(), 1)
        lux.set(val)
    except:
        pass

    # Schedule the poll() function for another 500 ms from now
    root.after(500, poll)

###############################################################################
# Main script

# Create the main window
root = tk.Tk()
root.title("The Big Screen")

# Create the main container
frame = tk.Frame(root)

# Lay out the main container (expand to fit window)
frame.pack(fill=tk.BOTH, expand=1)

# Variables for holding temperature and light data
temp_c = tk.DoubleVar()
lux = tk.DoubleVar()

# Create dynamic font for text
dfont = tkFont.Font(size=-24)

# Create widgets
label_temp = tk.Label(frame, text="Temperature:", font=dfont)
label_celsius = tk.Label(frame, textvariable=temp_c, font=dfont)
label_unitc = tk.Label(frame, text="°C", font=dfont)
label_light = tk.Label(frame, text="Light:", font=dfont)
label_lux = tk.Label(frame, textvariable=lux, font=dfont)
label_unitlux = tk.Label(frame, text="lux", font=dfont)
button_quit = tk.Button(frame, text="Quit", font=dfont, command=root.destroy)

# Lay out widgets in a grid in the frame
label_temp.grid(row=0, column=0, padx=5, pady=5, sticky=tk.E)
label_celsius.grid(row=0, column=1, padx=5, pady=5, sticky=tk.E)
label_unitc.grid(row=0, column=2, padx=5, pady=5, sticky=tk.W)
label_light.grid(row=1, column=0, padx=5, pady=5, sticky=tk.E)
label_lux.grid(row=1, column=1, padx=5, pady=5, sticky=tk.E)
label_unitlux.grid(row=1, column=2, padx=5, pady=5, sticky=tk.W)
button_quit.grid(row=2, column=2, padx=5, pady=5)

# Make it so that the grid cells expand out to fill window
for i in range(0, 3):
    frame.rowconfigure(i, weight=1)
for i in range(0, 3):
    frame.columnconfigure(i, weight=1)

# Bind F11 to toggle fullscreen and ESC to end fullscreen
root.bind('<F11>', toggle_fullscreen)
root.bind('<Escape>', end_fullscreen)

# Have the resize() function be called every time the window is resized
root.bind('<Configure>', resize)

# Initialize our sensors
tmp102.init()
apds9301.init()

# Schedule the poll() function to be called periodically
root.after(500, poll)

# Start in fullscreen mode and run
toggle_fullscreen()
root.mainloop()
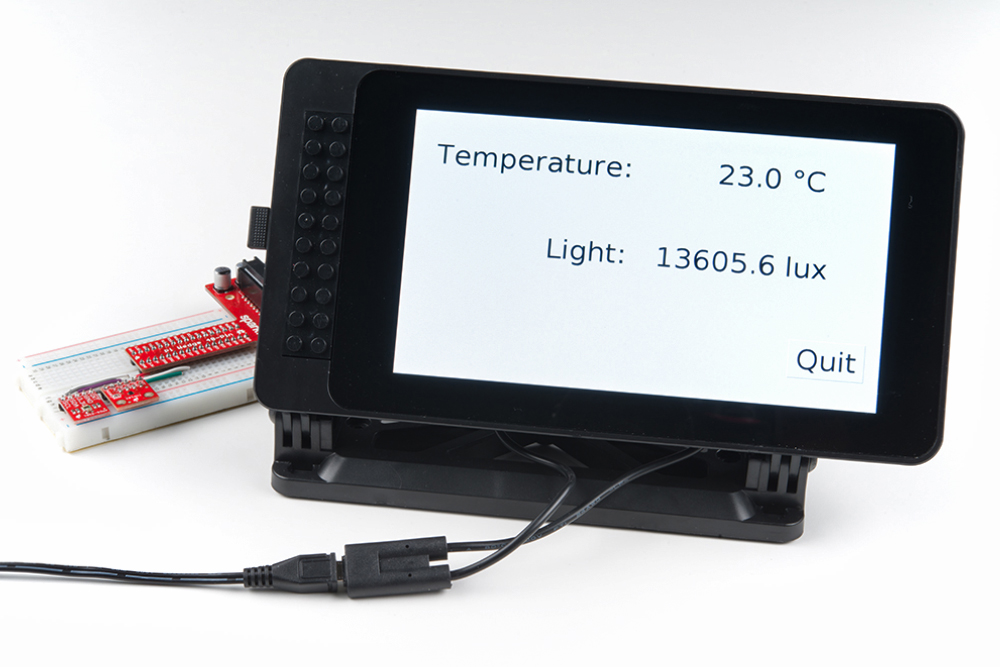
Save the file with a name like tkinter_fullscreen.py and run it. Your entire screen should be taken over by the GUI, and you should see the local ambient temperature and light values displayed. Try covering the light sensor or breathing on the temperature sensor to change their values. Press esc to exit fullscreen or press F11 to toggle fullscreen on and off.
Code to Note:
To control having our application take up the entire screen, we use the following method:
language:python
root.attributes('-fullscreen', fullscreen)
where the fullscreen variable is a boolean (True or False). If you look toward the end of the code, you'll see the following two lines:
language:python
root.bind('<F11>', toggle_fullscreen)
root.bind('<Escape>', end_fullscreen)
These bind the key presses F11 and esc to the toggle_fullscreen() and end_fullscreen() functions, respectively. These allow the user to control if the application takes up the entire screen or is in a window.
We also use the rowconfigure() and columnconfigure() methods again to control how the grid cells resize within the window. We combine this with a dynamic font:
language:python
dfont = tkFont.Font(size=-24)
Note that the negative number (-24) means we want to specify the font size in pixels instead of "points." We also have our resize() function called every time the window is resized with the following:
language:python
root.bind('<Configure>', resize)
In our resize() function, we calculate a new font size based on the height of the resized frame with:
language:python
new_size = -max(12, int((frame.winfo_height() / 10)))
This says that the new font size should be the height of the frame divided by 10, but no smaller than 12. We turn it into a negative value, as we want to specify font height in pixels instead of points (once again). We then set the new font size with:
language:python
dfont.configure(size=new_size)
Try it! With the application running, press esc to exit fullscreen mode and try resizing the window. You should see the text grow and shrink as necessary. It's not perfect, as certain aspect ratios will cut off portions of the text, but it should work without a problem in fullscreen mode (the intended application).
If you are using a touchscreen, you might not have an easy way for users to resize the window or quit out of the application (in some instances, that might be a good thing, but for our example, we want users to be able to exit). To accomplish this, we add a "Quit" button to our GUI:
language:python
button_quit = tk.Button(frame, text="Quit", font=dfont, command=root.destroy)
We assign the callback function to be root.destroy. This is a built-in method within Tkinter that says to close the associated window and exit out of mainloop.
You'll also notice that we are relying on the after() method again to call our poll() function at regular intervals.
Code Part 2: Complete Dashboard with Plotting
Now it's time to get fancy. Let's take the basic dashboard concept and add plotting. To do this, we'll need to pull in the Matplotlib package. If you have not already installed it, run the following commands in a terminal:
language:bash
sudo apt-get update
sudo apt-get install libatlas3-base libffi-dev at-spi2-core python3-gi-cairo
pip install cairocffi
pip install matplotlib
In a new file, copy in the following code:
language:python
import datetime as dt
import tkinter as tk
import tkinter.font as tkFont

import matplotlib.figure as figure
import matplotlib.animation as animation
import matplotlib.dates as mdates
from matplotlib.backends.backend_tkagg import FigureCanvasTkAgg
import tmp102
import apds9301

###############################################################################
# Parameters and global variables

# Parameters
update_interval = 60000 # Time (ms) between polling/animation updates
max_elements = 1440     # Maximum number of elements to store in plot lists

# Declare global variables
root = None
dfont = None
frame = None
canvas = None
ax1 = None
temp_plot_visible = None


# Global variable to remember various states
fullscreen = False
temp_plot_visible = True
light_plot_visible = True

###############################################################################
# Functions

# Toggle fullscreen
def toggle_fullscreen(event=None):

    global root
    global fullscreen

    # Toggle between fullscreen and windowed modes
    fullscreen = not fullscreen
    root.attributes('-fullscreen', fullscreen)
    resize(None)

# Return to windowed mode
def end_fullscreen(event=None):

    global root
    global fullscreen

    # Turn off fullscreen mode
    fullscreen = False
    root.attributes('-fullscreen', False)
    resize(None)

# Automatically resize font size based on window size
def resize(event=None):

    global dfont
    global frame

    # Resize font based on frame height (minimum size of 12)
    # Use negative number for "pixels" instead of "points"
    new_size = -max(12, int((frame.winfo_height() / 15)))
    dfont.configure(size=new_size)

# Toggle the temperature plot
def toggle_temp():

    global canvas
    global ax1
    global temp_plot_visible

    # Toggle plot and axis ticks/label
    temp_plot_visible = not temp_plot_visible
    ax1.collections[0].set_visible(temp_plot_visible)
    ax1.get_yaxis().set_visible(temp_plot_visible)
    canvas.draw()

# Toggle the light plot
def toggle_light():

    global canvas
    global ax2
    global light_plot_visible

    # Toggle plot and axis ticks/label
    light_plot_visible = not light_plot_visible
    ax2.get_lines()[0].set_visible(light_plot_visible)
    ax2.get_yaxis().set_visible(light_plot_visible)
    canvas.draw()

# This function is called periodically from FuncAnimation
def animate(i, ax1, ax2, xs, temps, lights, temp_c, lux):

    # Update data to display temperature and light values
    try:
        new_temp = round(tmp102.read_temp(), 2)
        new_lux = round(apds9301.read_lux(), 1)
    except:
        pass

    # Update our labels
    temp_c.set(new_temp)
    lux.set(new_lux)

    # Append timestamp to x-axis list
    timestamp = mdates.date2num(dt.datetime.now())
    xs.append(timestamp)

    # Append sensor data to lists for plotting
    temps.append(new_temp)
    lights.append(new_lux)

    # Limit lists to a set number of elements
    xs = xs[-max_elements:]
    temps = temps[-max_elements:]
    lights = lights[-max_elements:]

    # Clear, format, and plot light values first (behind)
    color = 'tab:red'
    ax1.clear()
    ax1.set_ylabel('Temperature (C)', color=color)
    ax1.tick_params(axis='y', labelcolor=color)
    ax1.fill_between(xs, temps, 0, linewidth=2, color=color, alpha=0.3)

    # Clear, format, and plot temperature values (in front)
    color = 'tab:blue'
    ax2.clear()
    ax2.set_ylabel('Light (lux)', color=color)
    ax2.tick_params(axis='y', labelcolor=color)
    ax2.plot(xs, lights, linewidth=2, color=color)

    # Format timestamps to be more readable
    ax1.xaxis.set_major_formatter(mdates.DateFormatter('%H:%M'))
    fig.autofmt_xdate()

    # Make sure plots stay visible or invisible as desired
    ax1.collections[0].set_visible(temp_plot_visible)
    ax2.get_lines()[0].set_visible(light_plot_visible)

# Dummy function prevents segfault
def _destroy(event):
    pass

###############################################################################
# Main script

# Create the main window
root = tk.Tk()
root.title("Sensor Dashboard")

# Create the main container
frame = tk.Frame(root)
frame.configure(bg='white')

# Lay out the main container (expand to fit window)
frame.pack(fill=tk.BOTH, expand=1)

# Create figure for plotting
fig = figure.Figure(figsize=(2, 2))
fig.subplots_adjust(left=0.1, right=0.8)
ax1 = fig.add_subplot(1, 1, 1)

# Instantiate a new set of axes that shares the same x-axis
ax2 = ax1.twinx()

# Empty x and y lists for storing data to plot later
xs = []
temps = []
lights = []

# Variables for holding temperature and light data
temp_c = tk.DoubleVar()
lux = tk.DoubleVar()

# Create dynamic font for text
dfont = tkFont.Font(size=-24)

# Create a Tk Canvas widget out of our figure
canvas = FigureCanvasTkAgg(fig, master=frame)
canvas_plot = canvas.get_tk_widget()

# Create other supporting widgets
label_temp = tk.Label(frame, text='Temperature:', font=dfont, bg='white')
label_celsius = tk.Label(frame, textvariable=temp_c, font=dfont, bg='white')
label_unitc = tk.Label(frame, text="C", font=dfont, bg='white')
label_light = tk.Label(frame, text="Light:", font=dfont, bg='white')
label_lux = tk.Label(frame, textvariable=lux, font=dfont, bg='white')
label_unitlux = tk.Label(frame, text="lux", font=dfont, bg='white')
button_temp = tk.Button(    frame,
                            text="Toggle Temperature",
                            font=dfont,
                            command=toggle_temp)
button_light = tk.Button(   frame,
                            text="Toggle Light",
                            font=dfont,
                            command=toggle_light)
button_quit = tk.Button(    frame,
                            text="Quit",
                            font=dfont,
                            command=root.destroy)

# Lay out widgets in a grid in the frame
canvas_plot.grid(   row=0,
                    column=0,
                    rowspan=5,
                    columnspan=4,
                    sticky=tk.W+tk.E+tk.N+tk.S)
label_temp.grid(row=0, column=4, columnspan=2)
label_celsius.grid(row=1, column=4, sticky=tk.E)
label_unitc.grid(row=1, column=5, sticky=tk.W)
label_light.grid(row=2, column=4, columnspan=2)
label_lux.grid(row=3, column=4, sticky=tk.E)
label_unitlux.grid(row=3, column=5, sticky=tk.W)
button_temp.grid(row=5, column=0, columnspan=2)
button_light.grid(row=5, column=2, columnspan=2)
button_quit.grid(row=5, column=4, columnspan=2)

# Add a standard 5 pixel padding to all widgets
for w in frame.winfo_children():
    w.grid(padx=5, pady=5)

# Make it so that the grid cells expand out to fill window
for i in range(0, 5):
    frame.rowconfigure(i, weight=1)
for i in range(0, 5):
    frame.columnconfigure(i, weight=1)

# Bind F11 to toggle fullscreen and ESC to end fullscreen
root.bind('<F11>', toggle_fullscreen)
root.bind('<Escape>', end_fullscreen)

# Have the resize() function be called every time the window is resized
root.bind('<Configure>', resize)

# Call empty _destroy function on exit to prevent segmentation fault
root.bind("<Destroy>", _destroy)

# Initialize our sensors
tmp102.init()
apds9301.init()

# Call animate() function periodically
fargs = (ax1, ax2, xs, temps, lights, temp_c, lux)
ani = animation.FuncAnimation(  fig,
                                animate,
                                fargs=fargs,
                                interval=update_interval)

# Start in fullscreen mode and run
toggle_fullscreen()
root.mainloop()
Save the program (with a fun name like tkinter_dashboard.py), and run it. You should see your sensor data displayed as numerical values as well as a plot that updates once per minute.
Try pushing the "Toggle Temperature" and "Toggle Light" buttons. You should see the graph of each one disappear and reappear with each button press. This demonstrates how you can make an interactive plot using both Tkinter and Matplotlib.
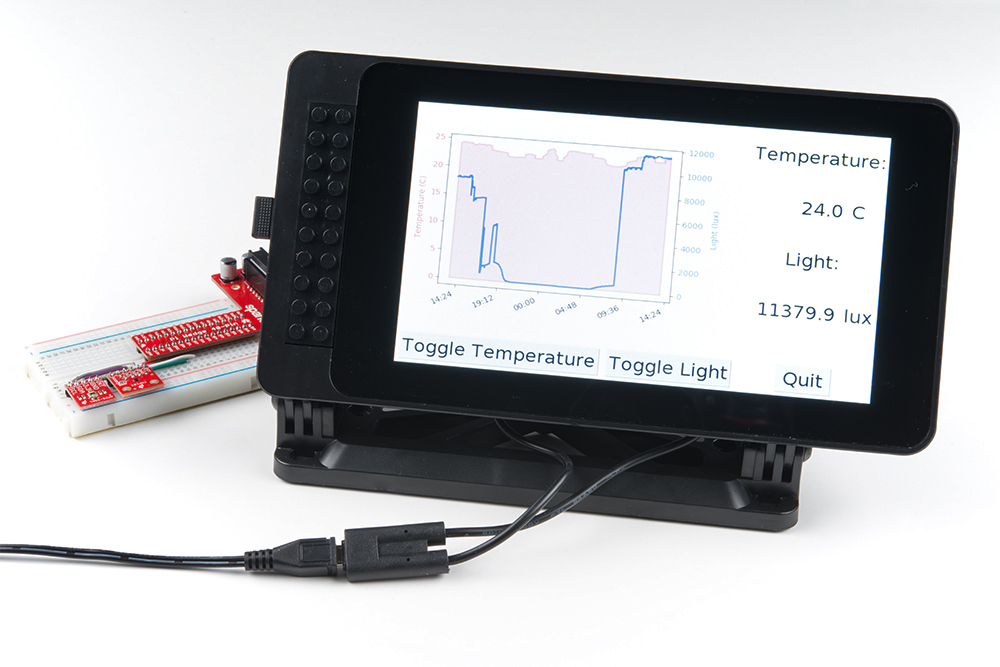
You can update the update_interval variable to have the sensors polled more quickly, but it can also be fun to poll once per minute (default) and let it run for a day, as I did in my office:
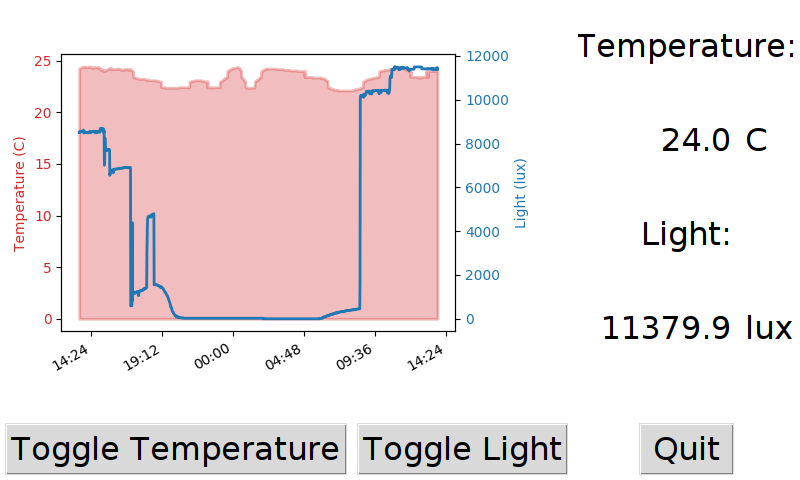
If you look closely at the graph, you can see that the temperatures fell a little after 7pm, rose again, and then fell once more just before the workday started at 9am the following morning. We can surmise that the building air conditioning was running at those times to make it cooler.
Additionally, you can see that someone came into the office in the 6-7pm timeframe, as the ambient light value picked up for a short amount. Considering I did not move the sensors the next day, it looks like either more lights were on, or it was a sunnier day outside, as more light was falling on the sensor.
Code to Note:
There is a lot going on in this example, so we'll try to cover it as succinctly as possible. Many of the concepts from the previous example, like binding key presses to trigger toggling fullscreen, are still present. Animating a graph is covered in the previous Python tutorial that introduced Matplotlib (specifically, the section about updating a graph in real time). If you are not familiar with Matplotlib, we recommend working through the following tutorial:
Graph Sensor Data with Python and Matplotlib
The key to embedding a Matplotlib graph into a Tkinter GUI is to work with Matplotlib's backend, which is why we import the following:
language:python
from matplotlib.backends.backend_tkagg import FigureCanvasTkAgg
With that, we first create our Matplotlib figure and a set of axes to draw our plot on:
language:python
# Create figure for plotting
fig = figure.Figure(figsize=(2, 2))
fig.subplots_adjust(left=0.1, right=0.8)
ax1 = fig.add_subplot(1, 1, 1)
A few lines later, we create a Tkinter widget out of that figure:
language:python
# Create a Tk Canvas widget out of our figure
canvas = FigureCanvasTkAgg(fig, master=frame)
canvas_plot = canvas.get_tk_widget()
These lines use our imported FigureCanvasTkAgg function to take a figure and turn it into a Tkinter Canvas. We get a handle to this canvas and lay it out in our grid just like any other widget:
language:python
canvas_plot.grid(   row=0,
                    column=0,
                    rowspan=5,
                    columnspan=4,
                    sticky=tk.W+tk.E+tk.N+tk.S)
Instead of the periodic poll() callback that we used in the previous examples, we set up a FuncAnimation() to handle the polling and updating of the graph:
language:python
# Call animate() function periodically
fargs = (ax1, ax2, xs, temps, lights, temp_c, lux)
ani = animation.FuncAnimation(  fig,
                                animate,
                                fargs=fargs,
                                interval=update_interval)
In the animate() function, we read the sensors' data (just like we did in poll()) and append it to the end of some arrays. We use this to redraw the plots on the axes (which are ultimately drawn on the Tkinter canvas widget). Note that we used .fill_between() to create the translucent red graph for temperature and a regular .plot() to create the basic blue line graph for light value.
For another example on importing Matplotlib into Tkinter, see this demo from the official Matplotlib documentation.