Getting Started with the SparkFun Inventor's Kit for Google's Science Journal App
Exploring Temperature
While the Making & Science activities don't include a temperature measuring activity, we thought we'd include a temperature sensor anyway. Let's take a look at how this sensor works!
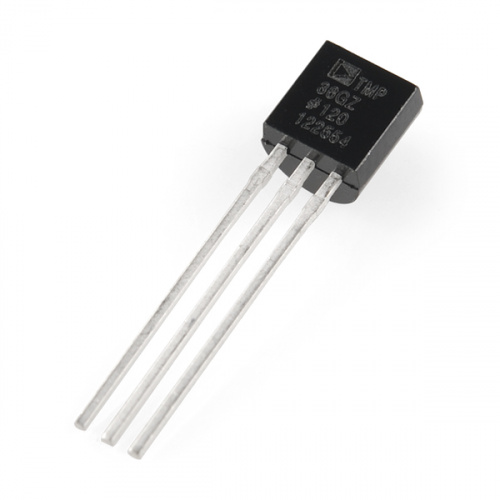
This little sensor has three legs and looks a bit like a transistor. It has a flat edge on one side and a rounded edge on the other.
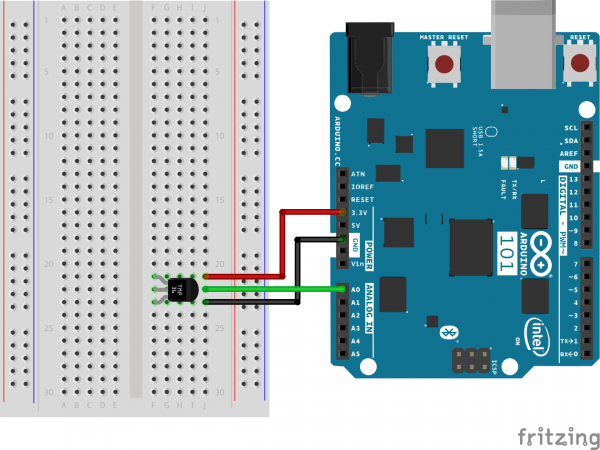
The three legs of this sensor are power, signal, and ground. When you hold the temperature sensor with the flat edge facing to the left, the top pin is power, the bottom pin is ground, and the one left is the signal. Connect up the circuit as shown in the figure.
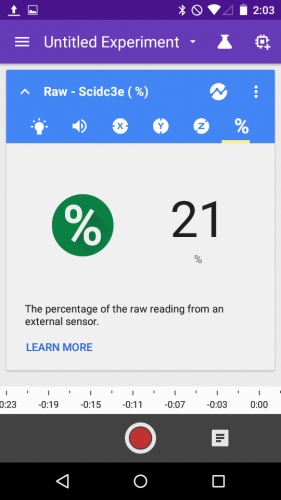
Setup the Science Journal to view this reading as a % Raw. Recall that this percentage is based off of a 3.3V scale on the Arduino 101. Cup your hands and blow deeply over the temperature sensor. Watch what happens to the Raw sensor reading!
Translating this to a real temperature
The way that this little temperature sensor works is this. The voltage on the signal pin (middle pin of the sensor) varies directly with temperature in degrees Celsius. The datasheet on the sensor shows a way to convert the voltage read on the pin into a temperature:
So, if I'm seeing a raw value of about 21%, what is that as a temperature? First, start with converting this to a voltage. 21% of 3.3V is (21/100)*3.3 = 0.693V.
Now, we simply plug this into the equation above:
But, what is this in Fahrenheit? Let me look up another quick conversion! Okay, the conversion for Celsius to Fahrenheit is:
And, we get the temperature in degrees Fahrenheit:
That's how the sensor works, and how you can connect it to your Arduino 101 and the Science Journal App. Because the Science Journal App only measures raw values for voltage, you will need to process your raw data using a calculator or in a spreadsheet to get values into degrees Fahrenheit. Use the equations we show above as an example to explore your world.


