Getting Started with the SparkFun Inventor's Kit for Google's Science Journal App
 bri_huang
Introduction
Google announced their Making & Science Initiative at the 2016 Bay Area Maker Faire. Making & Science is an initiative at Google to inspire future scientists through making and tinkering, and we're proud to be working with them to provide an electronics kit that is designed to support the Making & Science activities developed by Google with a team at the Exploratorium.

More information about the Making & Science initiative and these activities can be found at: makingscience.withgoogle.com

This kit includes all the electronics parts needed to start exploring and measuring your environment. The kit includes:
- Arduino 101 pre-programmed to work with the Science Journal App
- Breadboard & Breadboard holder
- 9V Battery & 9V Battery holder
- 9V Wall adapter
- Mini Photocell
- 10k Ohm resistors
- Temperature Sensor
- Cardboard cutouts for building your own Wind-Spinner Project
- And more!
The parts in this kit complement the features in the Science Journal App, a digital science notebook for your Android device. We've pre-programmed the Arduino 101; so, all you have to do is get the app, power up your Arduino 101, and start exploring the awesome activities with the Science Journal.
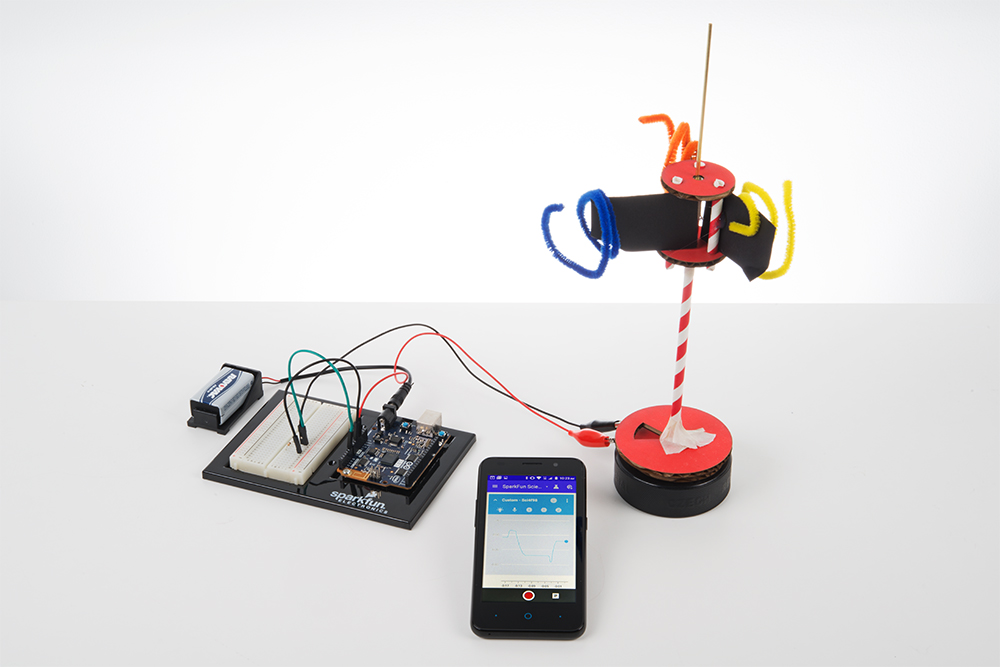
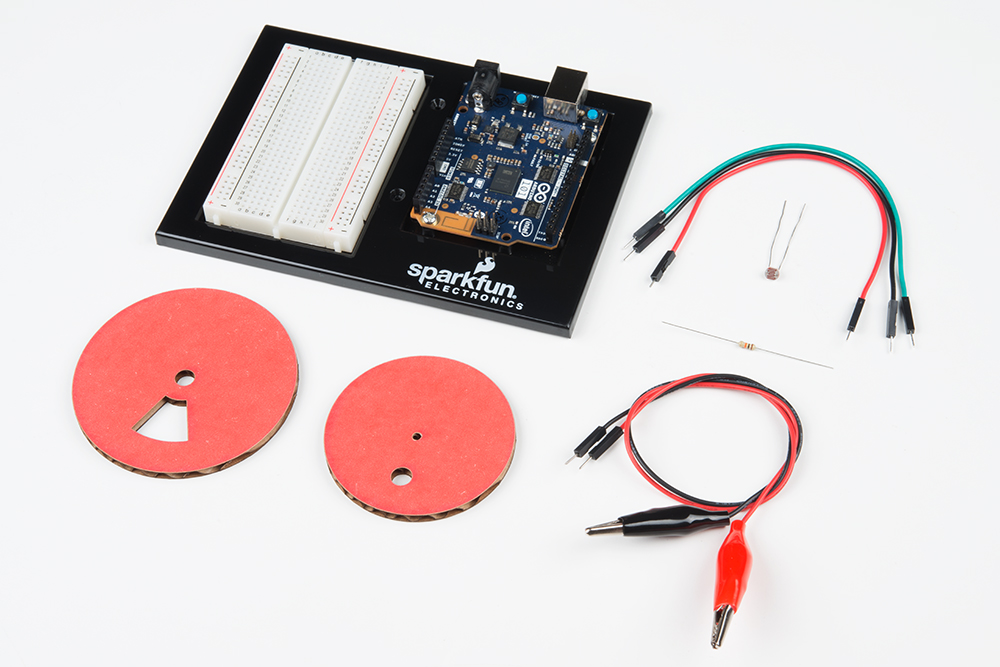
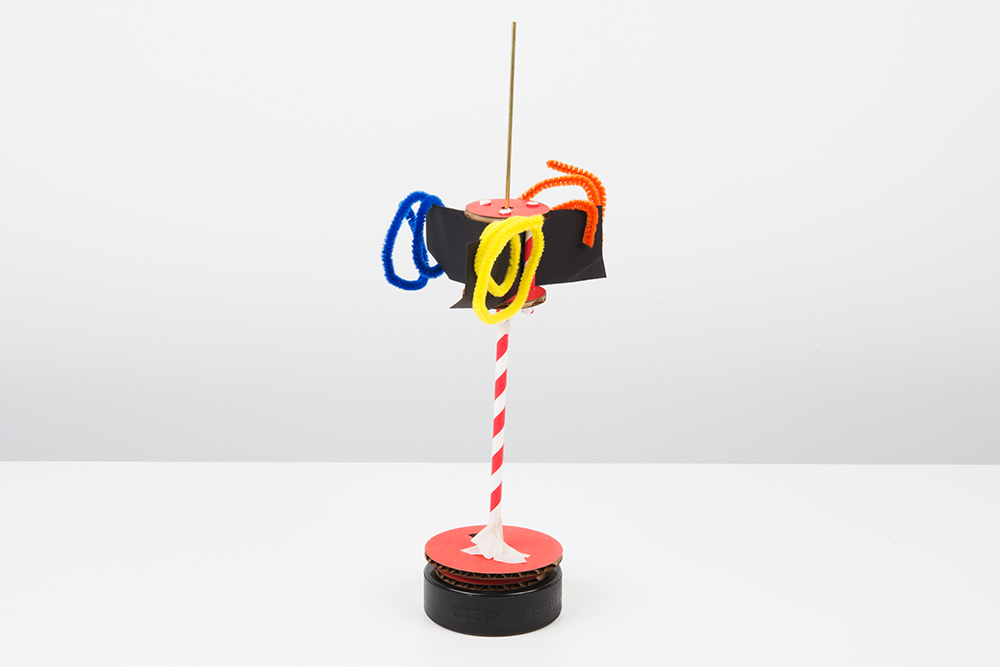
This guide is only a supplement to the materials found on the Science Journal site. In this guide, we'll show you how to hook up two external sensors to the Arduino 101 with the Science Journal. With the materials in the kit and the ideas from the Science Journal website, you'll be able to make your very own windspinner project like the one pictured below and more! Let's get started.
The Science Journal App
The Science Journal App is a digital science notebook. It interfaces directly with the built-in sensors on your device such as a light sensor, sound sensor, and accelerometer. With the app, you can record data, make notes, and save it all to your Google Drive account.

If you haven't already done so, click here to download the Science Journal App for your android device or find it on the Google Play Store.
This app will enable you to explore your surroundings using the built-in sensors on the phone, take notes on your scientific observations, and interface with additional sensors that you build and connect up to the pre-programmed bluetooth-enabled Arduino 101.
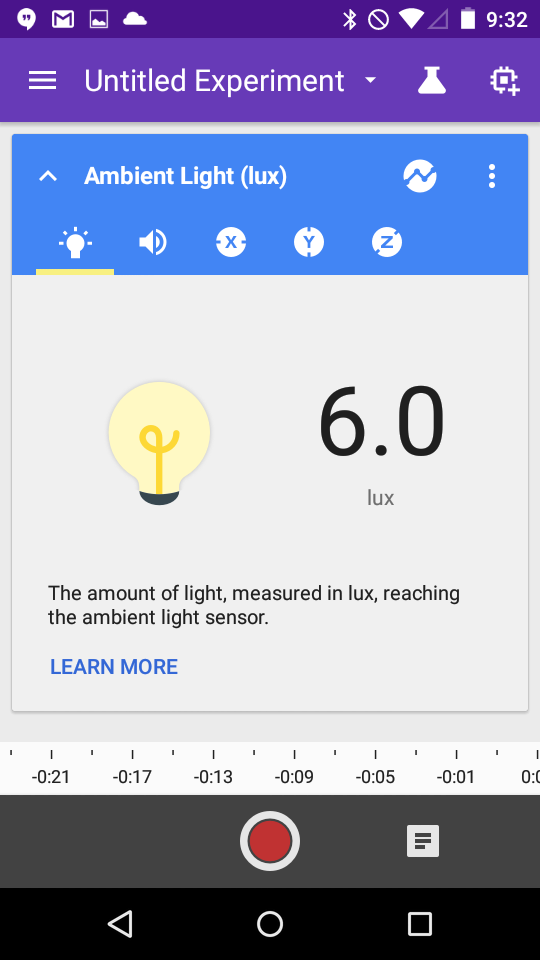
The first few experiments in the Making & Science activities are focused around the sensors directly on the phone. These are designed to acquaint you with the app and the interface. Be sure to explore those first. Explore your environment using the built-in light sensor, sound level, and accelerometer on your phone. The app can show either the present value of a sensor or a real-time graph of the data:
And, you can also tap the record button to log your trial and save your data to analyze later. Now that you've explored the app, let's add some external sensors using the Arduino 101.
The Arduino 101
The Arduino 101 is a development board based on the Intel Curie module that leverages the simplicity of the Arduino programming environment. If you got the SIK for Google's Science Journal App, we pre-programmed this board for you to work directly with the Google Science Journal. If you have your own Arduino 101 and need to program it for the Science Journal, you can get the full source-code on github here.

This board has a built-in Bluetooth chip and is pre-programmed to communicate directly with the Science Journal App. This board will allow you to connect a variety of sensors to the Science Journal App through the Analog Pins (A0 - A5) with a little bit of circuit building.
When you've completed your science experiments with the Science Journal and you want to go further, we have a whole series of activities and experiments that you can explore to learn more about programming and electronics using your Arduino 101, but we're getting ahead of ourselves. Let's start with pairing the Arduino 101 to your Science Journal App.
Pairing the Arduino 101 to your Science Journal
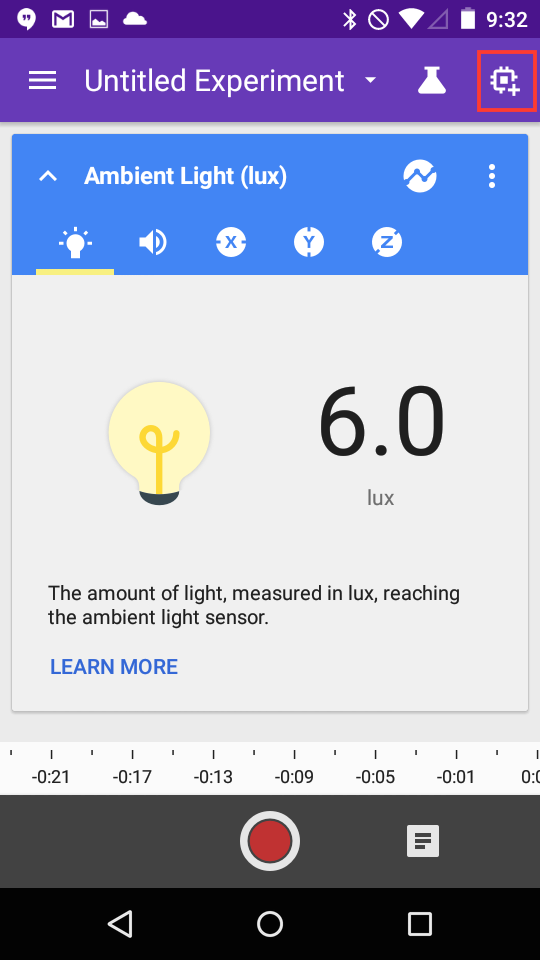
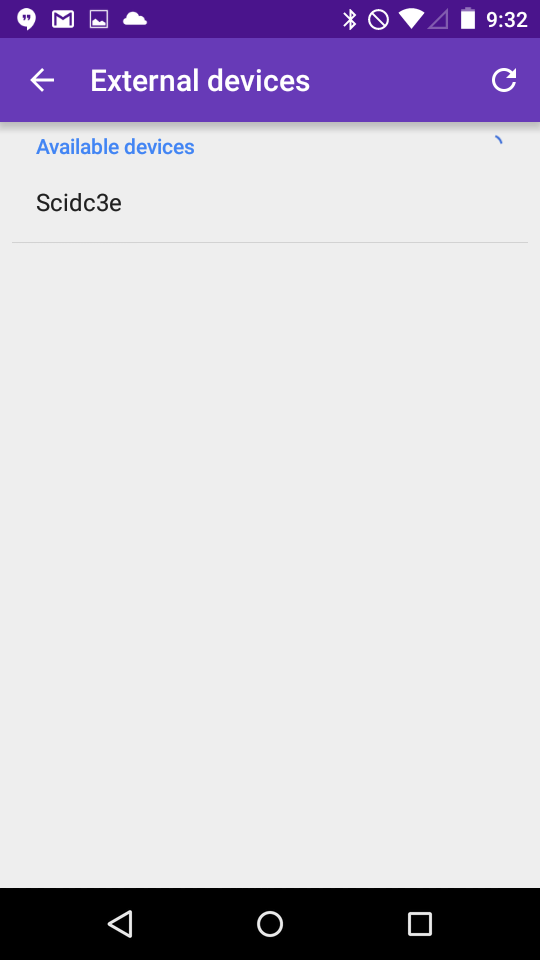
The Arduino 101 will allow you to add external sensors to your Science Journal. First power up the Arduino 101 using either the USB cable, the 9V battery and battery adapter, or the wall adapter. Next, open up the Science Journal App and click on the add device icon in the upper right corner of the screen:
Next, identify the name of the Arduino 101 that you have. It will start with the letters "Sci" for Science and then have 4 extra unique characters that follow it. In our case, it's named Scidc3e.
Configuring the Arduino 101 readings
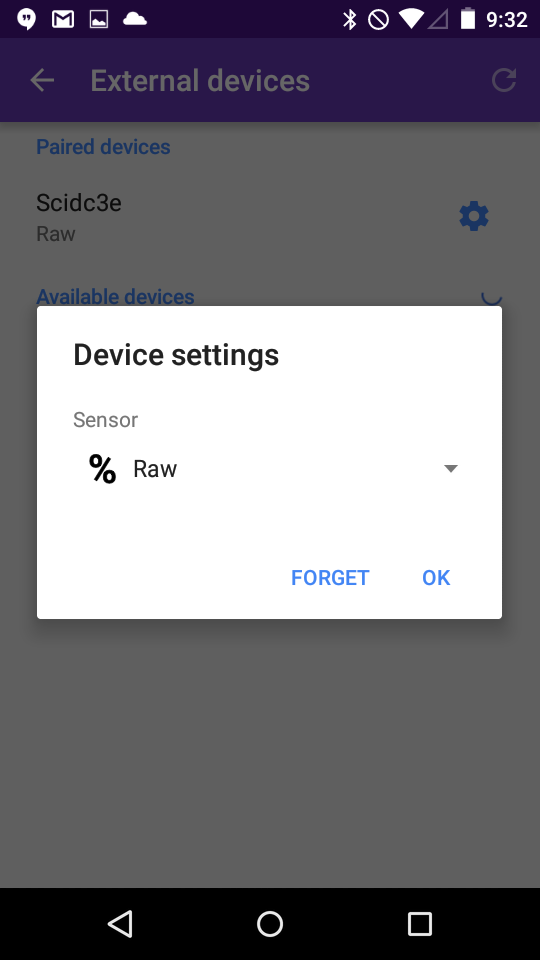
Tap on this device name to pair it. Now, you have a few options that you can configure for how you want to read sensor data from your Arduino 101. As a default, the Arduino 101 is looking at the voltage on pin A0. The app is configured to show this information as either Rotations or Raw values.
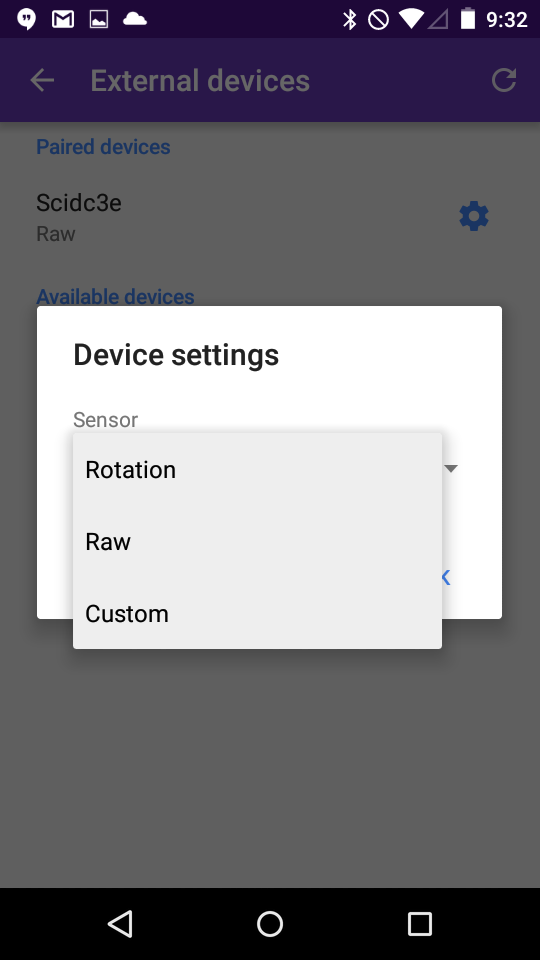
The Rotations setting takes an average of the number of light and dark transitions and estimates the rotations per minute (RPM) that an encoder disk is spinning. We use this in the Wind Spinner project later on. And, the Raw setting will display the voltage as a percentage from 0 to 100. A voltage of 3.3V will show 100%.
Going further with the Custom setting
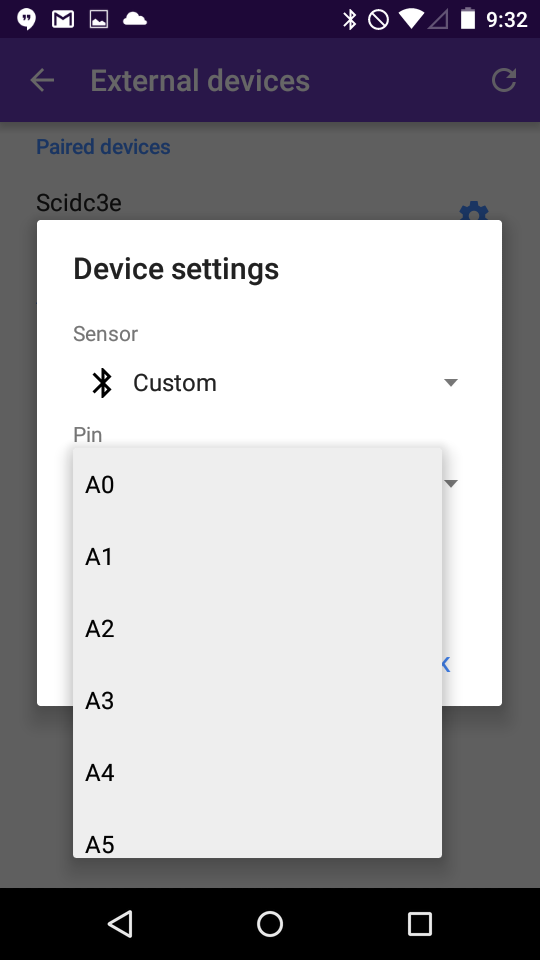
If you want to explore other sensors or see the raw analog-to-digital (ADC) value, you can go into the Custom option. Under this option, you can select any of the available Analog pins on the Arduino 101 (A0 - A5).
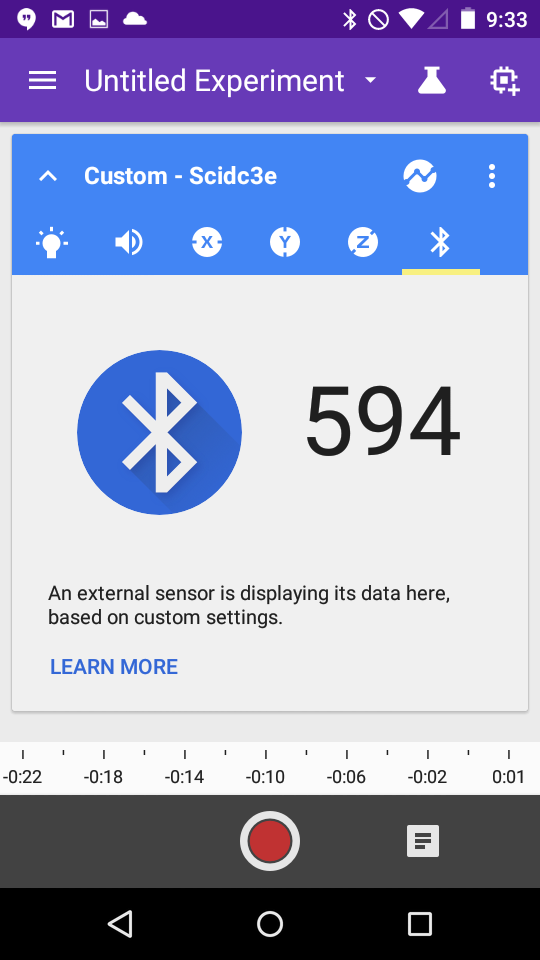
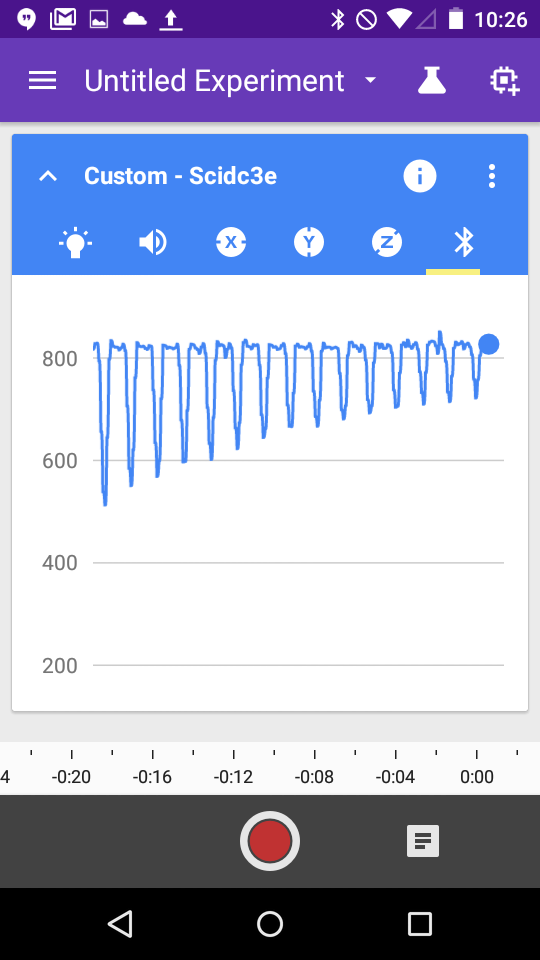
Once you've configured the sensor on the app, tap the back arrow to get back to your experiment, and slide your finger sideways until you see the new icon appear on the right side. For the custom sensor, this will appear as a bluetooth icon, and this will show a value of 0 - 1023 based on the actual sensor reading of the Arduino device. These are really unit-less values, but I'm pretty sure we can still make some good predictions and conclusions based on patterns that we see in the data.
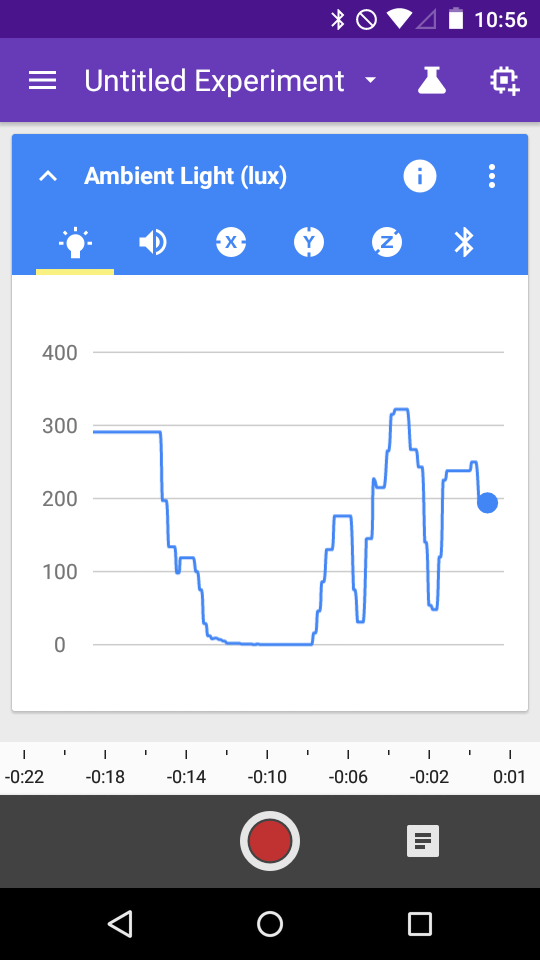
If you've explored all of the features of the app, you know that we can also display this data graphically. Here's a graph of a "pendulum" chandalier that I made swing back and forth over the top of the light sensor.
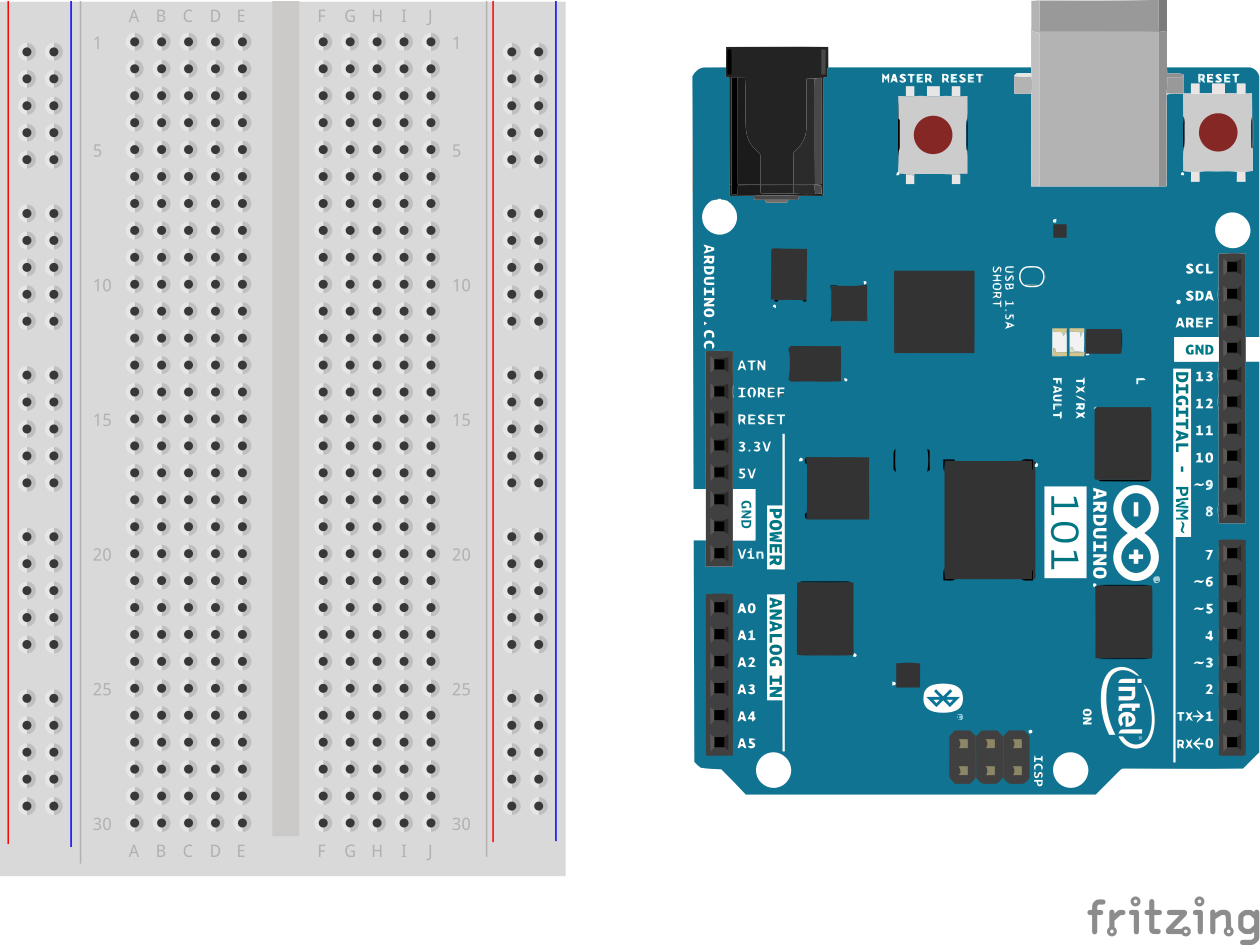
Last thing. If you haven't mounted your Arduino 101 board onto the plastic breadboard holder, you should do that now. Orient the Arduino 101 board and the breadboard (the white thing with a lot of holes in it) so that it looks like the diagram below. There are some little screws that you can use to afix the Arduino 101 board down, and the breadboard has a self-adhesive backing that you can use.
Now you're ready to go and start exploring with the Science Journal and your new Arduino 101 sensor kit. We've included two sensors in the kit that we'll show you how to setup next.
Exploring Light (and rotations) with the photocell
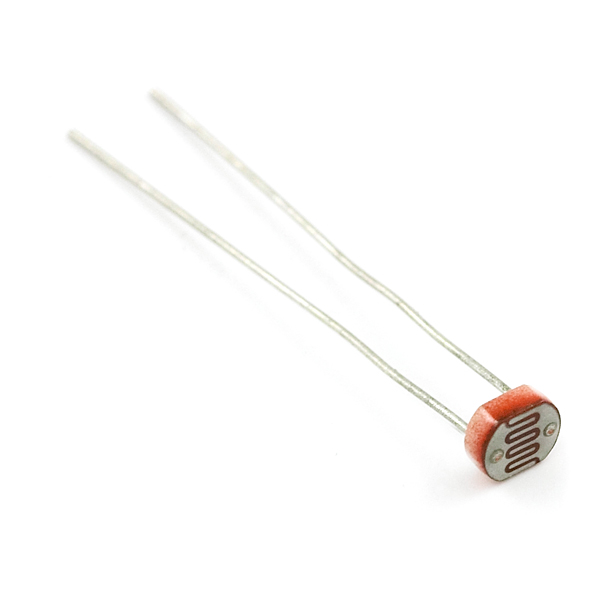
In our kit, we provide a simple photocell that can be used for measuring the light level in an area. The device changes resistance based on the amount of light reaching the face of the sensor.
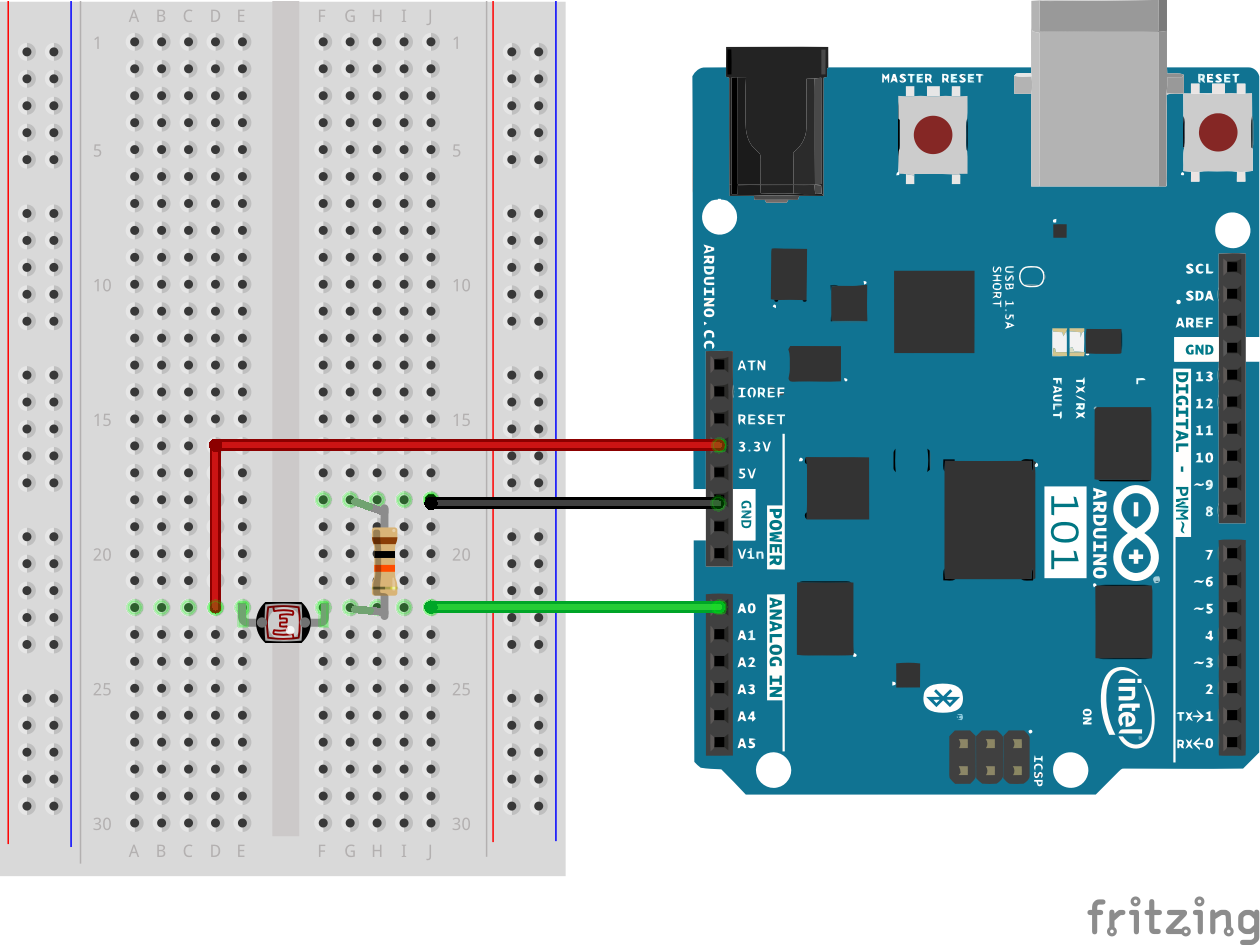
To use the photocell, we need to build a simple voltage divider circuit. We will use the solderless breadboard to to build our circuit. The solderless breadboard is the white, rectangular board that has a series of holes all over it. It is used to connect wires together without twisting them together or using solder. When you plug two wires into the same row (of 5 adjacent holes), the two wires are held together by a small metal clip. These are the parts that you'll need to gather.
Parts needed
- photocell
- 10k Ohm resistor (brown-black-orange)
- 3 male-to-male jumper wires
- 2 alligator clip to male pin jumpers
- Arduino 101 and breadboard
- cardboard photocell holder and encoder disk - pdf / svg template
- an axle (a 3/32 welding rod or a bamboo skewer)
- heavy base (2x4 piece of lumber or a hockey puck with a 3/32 hole drilled into it)
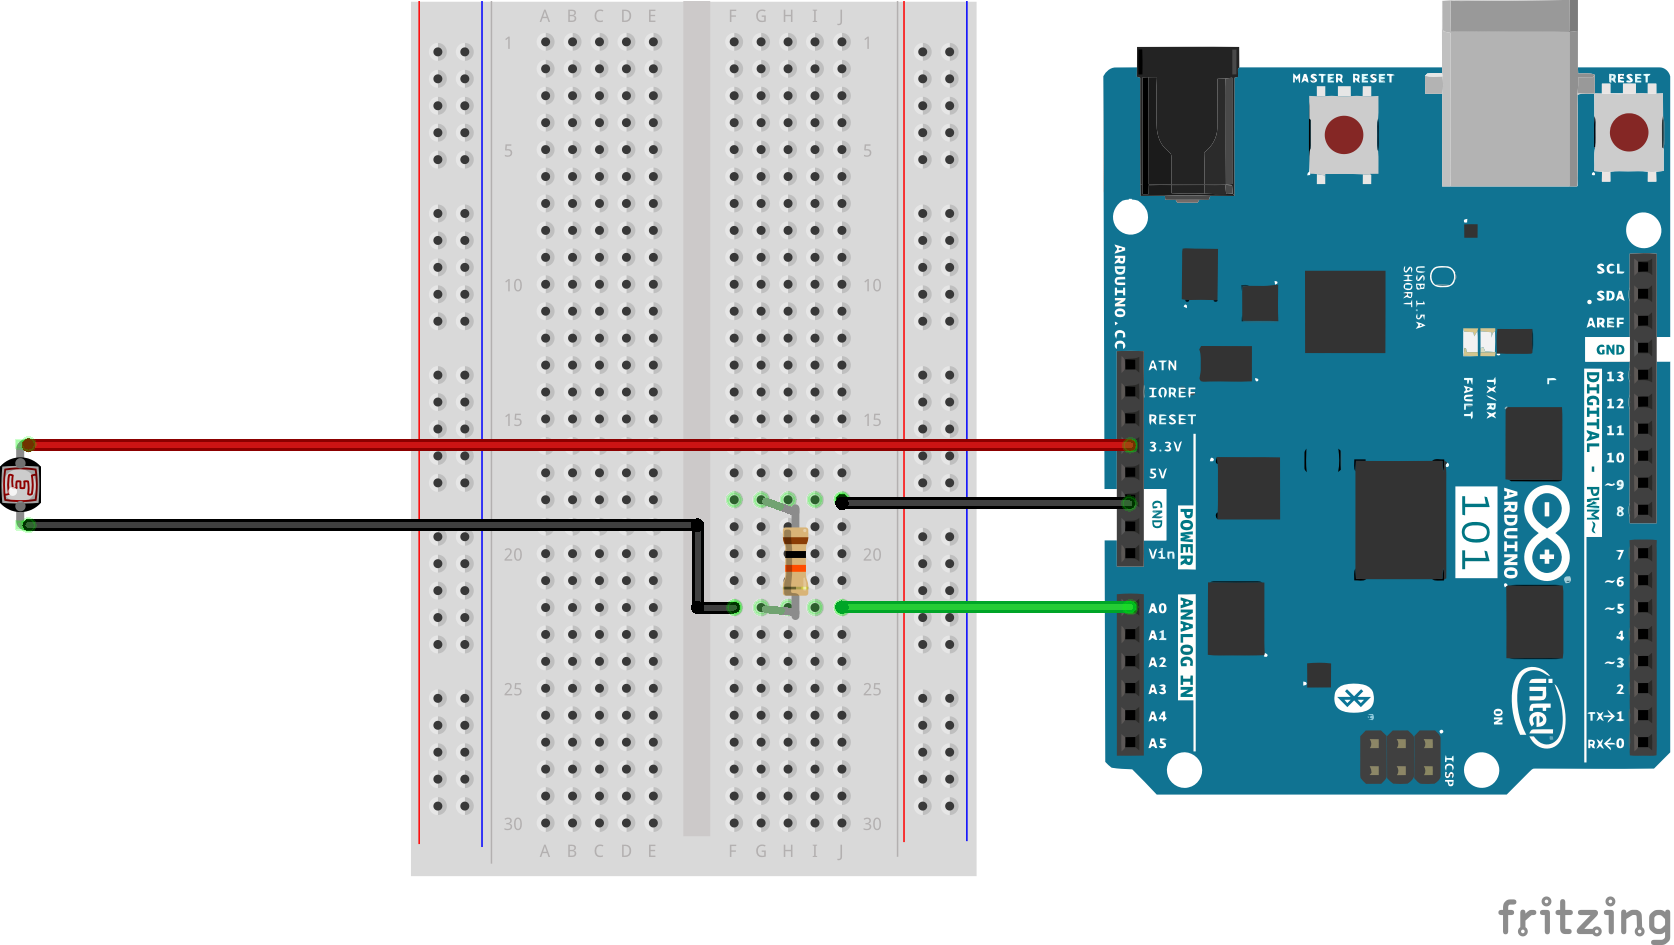
Find the photocell and a 10k ohm resistor. The 10k ohm resistor will have the color bands (brown-black-orange). Connect up the parts to the circuit on the breadboard so that it matches the diagram below. Pay close attention to where the wires go. Remember that wires are connected together when they share the same row of holes.
Now, go back to the Science Journal and setup the external sensor to display the external sensor data as % Raw.
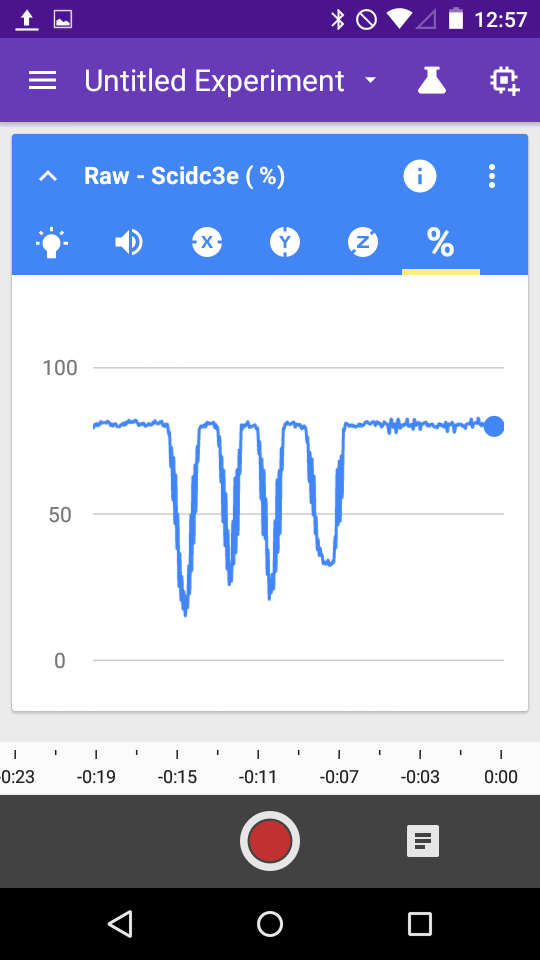
In the Experiment view, select the graph setting, and move your hand up and down in front of the light sensor. What do you see? You should get a graph that's similar to the one below. What value does it show when there's a lot of light? How about when it's dark?
Now, you have a light sensor that you can place anywhere! What kinds of things would you monitor?
What's Going on?
The circuit that you built is what is called a voltage divider. Drawn in circuit form it looks a little bit like this:
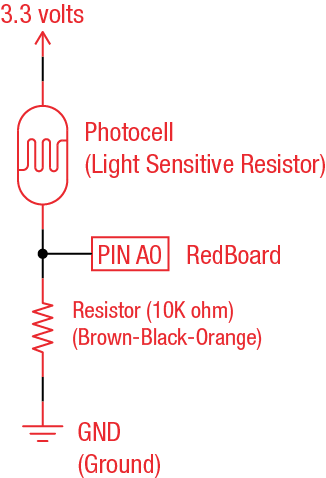
When you have two resistors connected up in series like this. The voltage is divided across the two resistors proportionally based on their resistances. So, if the resistance of the photocell changes, then the voltage split between the two resistors also changes. This is why they call it a voltage divider.
Measuring RPM and Building a Wind Spinner!
One of the great activities that the team at Google and the Exploratorium developed is the Windspinner. To use the photocell to measure windspeed, we need to build a photocell encoder wheel. The photocell encoder wheel is a rotating disk with a window cutout. As the wheel spins, it exposes the photocell to light once per rotation. The Arduino 101 is constantly monitoring the sensor and it sends the raw sensor data to the Science Journal App. When the external sensor is setup to display Rotations the app converts these light / dark pulses into a measurement of rotations per minute (RPM).
To make this project, you might need a few extra parts that aren't included in the kit. Most of these are materials that you can find around the average household.
- You'll need something to make an axle - a bamboo skewer or a 3/32" welding rod work great.
- You'll also need something to form the base of your Wind Spinner. We're using a hockey puck that we drilled a small hole into, but a 2x4 or scrap piece of wood works as well!
- And, finally, you'll need some craft materials. We suggest some paper straws, construction paper, and chenille stems (pipe cleaners) to start!
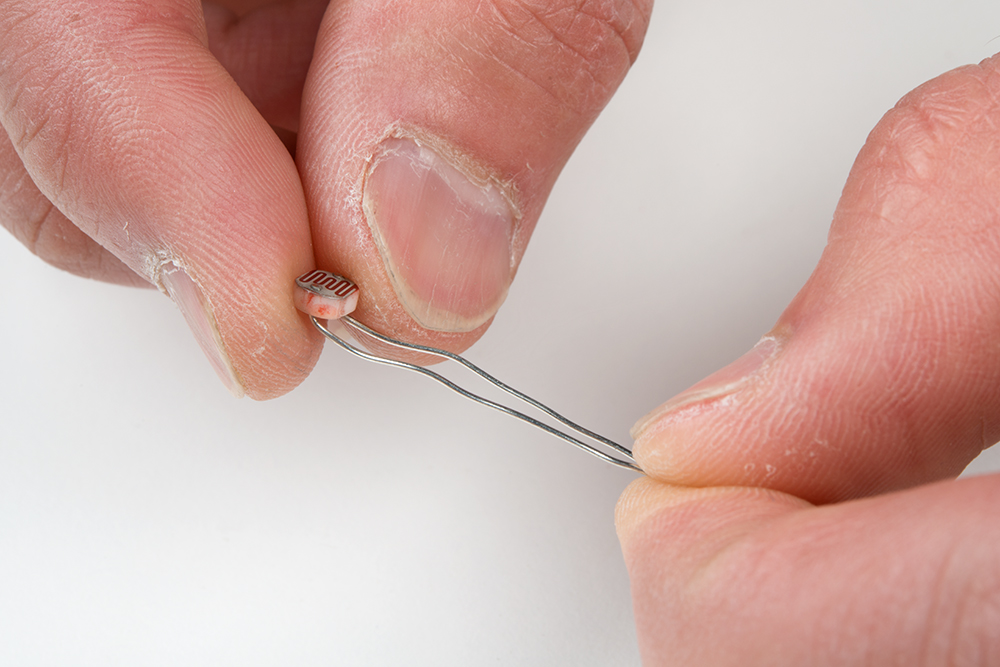
To start, remove the photocell from the breadboard. Bend the head of the photocell 90 degrees so that it is flat. This will make it easier to fit into the photocell holder.
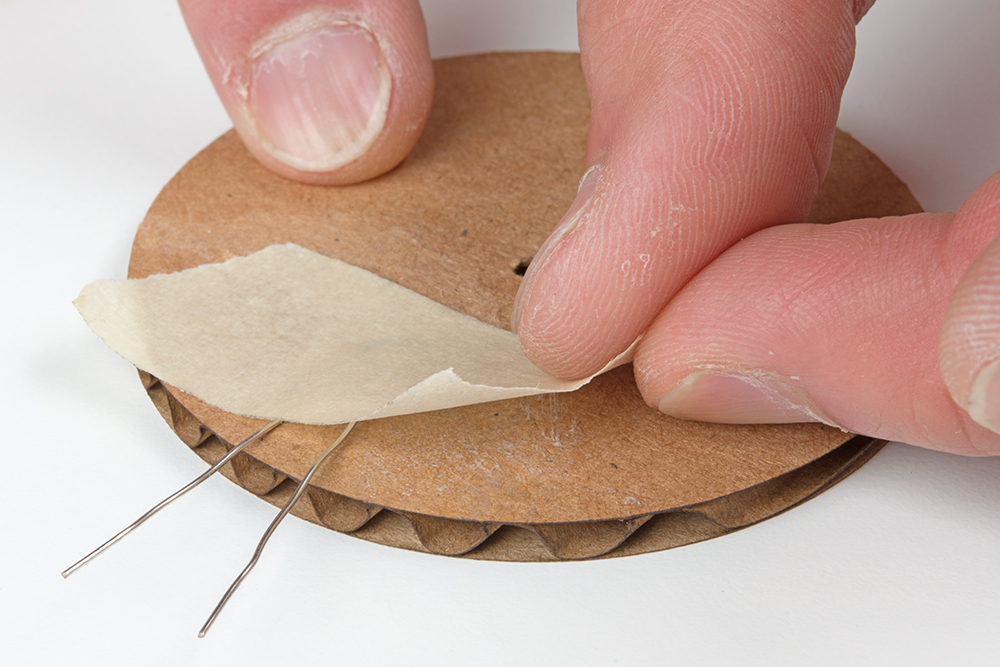
Now, insert the photocell into the small offset hole on the photocell holder, and tape it in place using a small piece of masking tape.
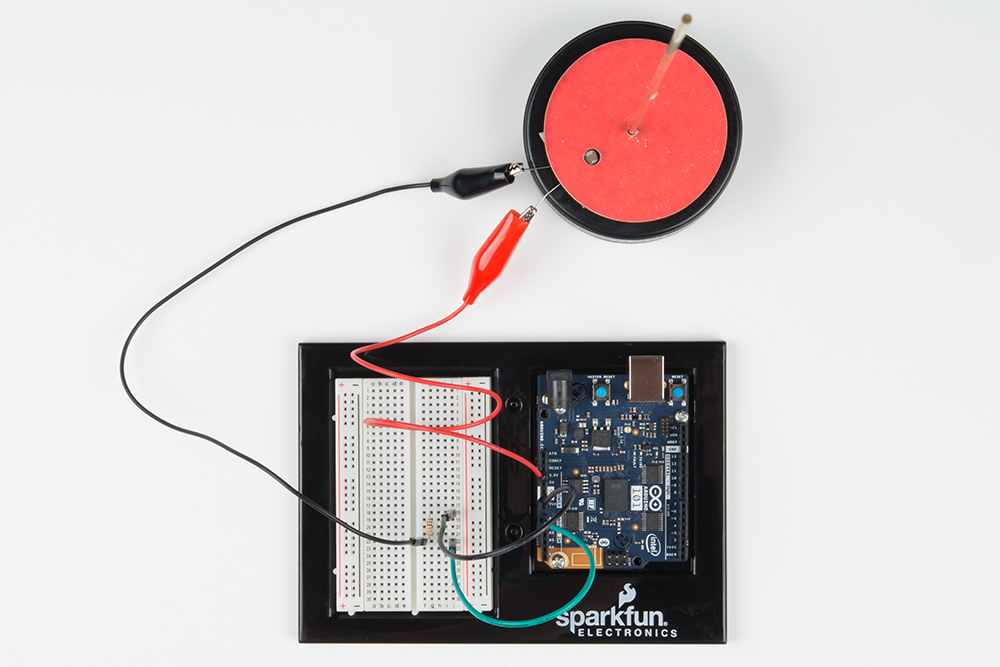
Using a 3/32" welding rod or a bamboo skewer as an axle, insert the axle through the center of the photocell holder. We also made a base using a hockey puck, but a piece of 2x4 or other material will work too. Remove the red wire from the 3.3V pin on the Arduino 101 to the breadboard, and connect the photocell back using the alligator clips as shown in the figures below.
Now you have the base of your photocell encoder built. Time to build the rest of the Wind Spinner.
Build your Wind Spinner!
When testing the wind speed, make sure to change the sensor settings in the app back to Rotations. The encoder disk (the one with an offset window cutout) will form the base of the wind spinner. Use a straw to make a sleeve for your wind spinner to spin around the axle, and use the other cardboard cut-out wheels or other craft materials to invent your own wind spinner. Be sure to record your ideas and observations inside the Science Journal App!
What factors affect the speed of your design?
Need more ideas? Check out the resources at g.co/sciencejournalapp
Exploring Temperature
While the Making & Science activities don't include a temperature measuring activity, we thought we'd include a temperature sensor anyway. Let's take a look at how this sensor works!
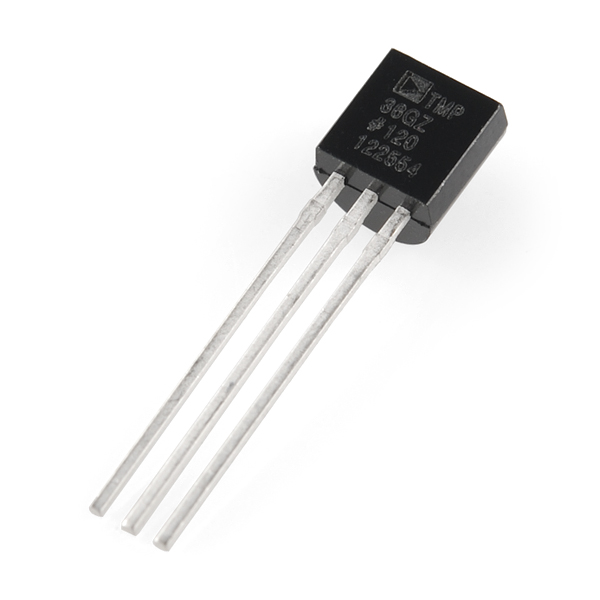
This little sensor has three legs and looks a bit like a transistor. It has a flat edge on one side and a rounded edge on the other.
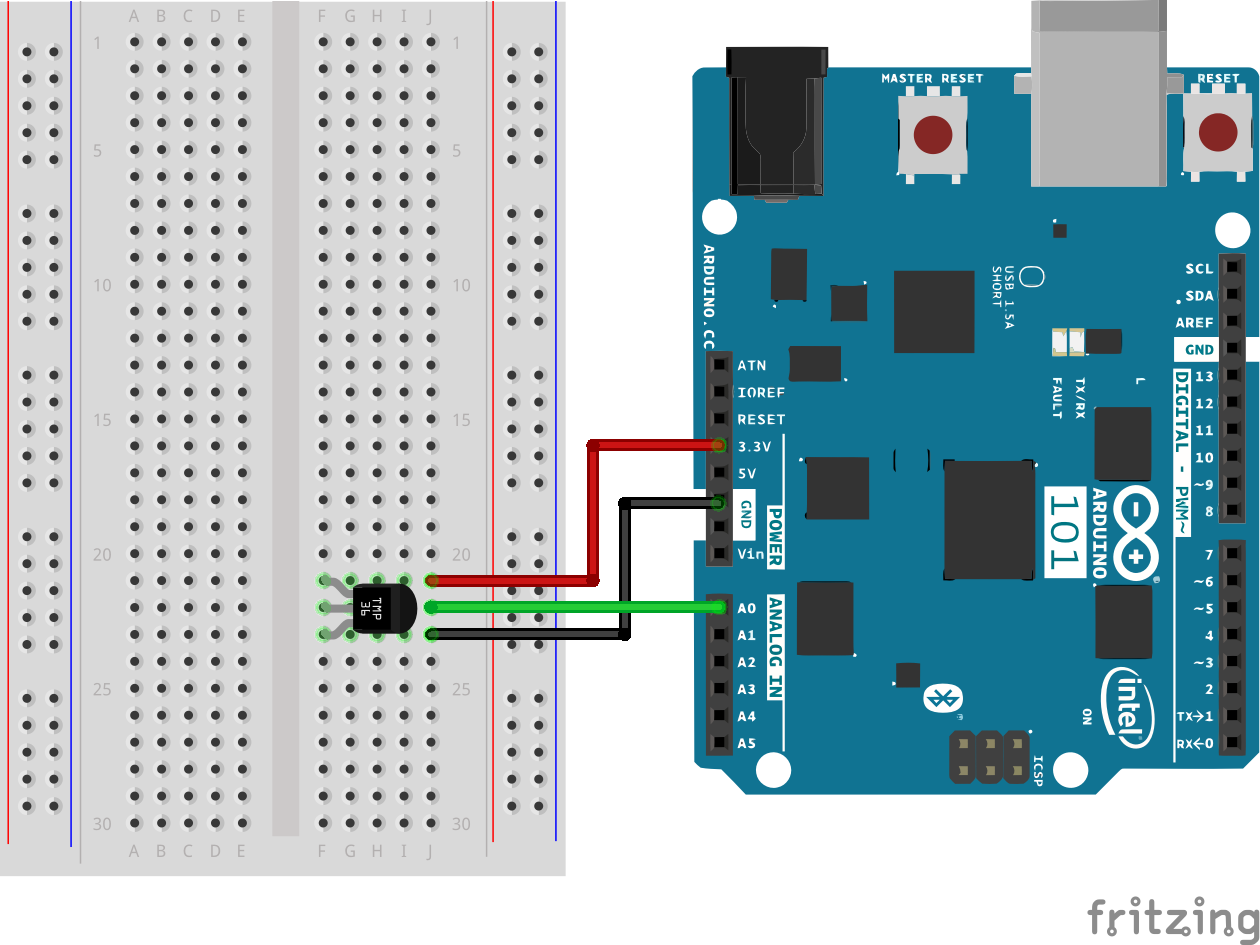
The three legs of this sensor are power, signal, and ground. When you hold the temperature sensor with the flat edge facing to the left, the top pin is power, the bottom pin is ground, and the one left is the signal. Connect up the circuit as shown in the figure.
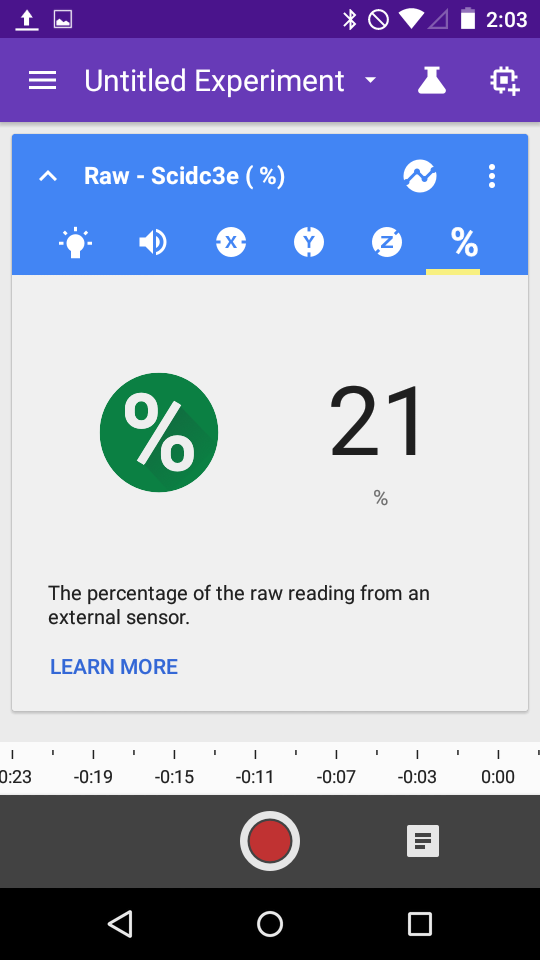
Setup the Science Journal to view this reading as a % Raw. Recall that this percentage is based off of a 3.3V scale on the Arduino 101. Cup your hands and blow deeply over the temperature sensor. Watch what happens to the Raw sensor reading!
Translating this to a real temperature
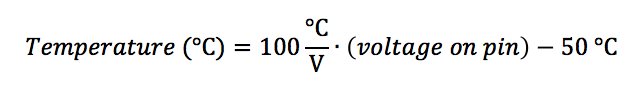
The way that this little temperature sensor works is this. The voltage on the signal pin (middle pin of the sensor) varies directly with temperature in degrees Celsius. The datasheet on the sensor shows a way to convert the voltage read on the pin into a temperature:
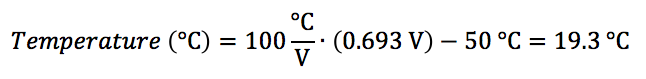
So, if I'm seeing a raw value of about 21%, what is that as a temperature? First, start with converting this to a voltage. 21% of 3.3V is (21/100)*3.3 = 0.693V.
Now, we simply plug this into the equation above:
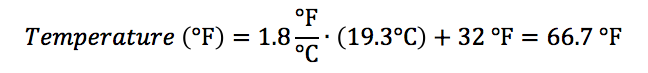
But, what is this in Fahrenheit? Let me look up another quick conversion! Okay, the conversion for Celsius to Fahrenheit is:

And, we get the temperature in degrees Fahrenheit:
That's how the sensor works, and how you can connect it to your Arduino 101 and the Science Journal App. Because the Science Journal App only measures raw values for voltage, you will need to process your raw data using a calculator or in a spreadsheet to get values into degrees Fahrenheit. Use the equations we show above as an example to explore your world.
Resources and Going Further
With the Science Journal app and the Arduino 101, there are a lot of different science experiments you can perform. You can use the Custom option in the Science Journal and view the actual raw data value read in by the Arduino 101. These values will vary from 0 - 1023 and are directly proportional to a voltage scale from 0 to 3.3V. With this information, can you make your very own voltmeter?
Next steps?
Google and the Exploratorium are developing more activities and experiments for you to investigate, and they've asked us for feedback from the Sparkfun Community. Let us know if you have other ideas of science experiments you'd like to try or that you'd to see developed!
Click on the comments tab on the right to share your ideas with us!
We look forward to seeing what you make!