Spectrum Shield Hookup Guide (v2)
Arduino Example Code
Note: This tutorial assumes you are using the latest version of the Arduino IDE on your desktop. If this is your first time using Arduino, please review our tutorial on installing the Arduino IDE.
Serial Plotter Example
Now that you have your hardware all hooked up, it's time to analyze some audio signals. Below, we will walk through the SparkFun_Spectrum_Shield_Serial_Plotter_Demo.ino sketch. To begin, download that sketch from the GitHub Repository, and upload it to your Arduino. (*The .zip folder must be extracted and the file for the sketch is located in the Spectrum_Shield > Firmware > SparkFun_Spectrum_Serial_Plotter_Demo folder.)
Code Overview
The start of the demo code defines the pins functionality. The Spectrum Shield pin connections to the microcontroller must be defined.
language:c
//Declare Spectrum Shield pin connections
#define STROBE 4
#define RESET 5
#define DC_One A0
#define DC_Two A1

//Define spectrum variables
int freq_amp;
int Frequencies_One[7];
int Frequencies_Two[7];
int i;
Note that we declare two arrays Frequencies_One[] and Frequencies_Two[]; these will be used to store the output of the seven frequency bands from the MSGEQ7 ICs. (*The freq_amp and i variables are counters used for iterations in the code and carry minimal significance.)
In the setup loop, the shield pins must also be declared as OUTPUTs for the STROBE and RESET pins so we can control the shield using the RedBoard. The DC analog pins are each declared as an INPUT in the code, because the RedBoard will be reading data in from these pins. Once the pins are declared, control pins (STROBE and RESET) are set to a LOW condition/output. A delay is added for the settings to take effect, then the serial output is initialized to a 9600 bps bard rate.
language:c
/********************Setup Loop*************************/
void setup() {
  //Set spectrum Shield pin configurations
  pinMode(STROBE, OUTPUT);
  pinMode(RESET, OUTPUT);
  pinMode(DC_One, INPUT);
  pinMode(DC_Two, INPUT);

  //Initialize Spectrum Analyzers
  digitalWrite(STROBE, LOW);
  digitalWrite(RESET, LOW);
  delay(5);

  Serial.begin(9600);
}
For the main section of the sketch, we loop through two user-defined functions. Read_Frequenices() and Graph_Frequencies() tell the RedBoard to read the frequencies coming off the Spectrum Shield, and serial print out the analog values, respectively.
language:c
/****************Main Function Loop***************************/
void loop() {

  Read_Frequencies();
  Graph_Frequencies();
  delay(50);

}
The Read_Frequencies() function is defined next in the code. When called, the function initializes/resets the ICs by cycling the RESET pin as described earlier in the Control Pins section. Then, the function steps through each frequency band on the Spectrum Shield using the STROBE pin, reads the DC analog outputs, and stores the values into the predefined frequency arrays.
language:c
/*************Pull frquencies from Spectrum Shield****************/
void Read_Frequencies() {
  digitalWrite(RESET, HIGH);
  delayMicroseconds(200);
  digitalWrite(RESET, LOW);
  delayMicroseconds(200);

  //Read frequencies for each band
  for (freq_amp = 0; freq_amp < 7; freq_amp++)
  {
    digitalWrite(STROBE, HIGH);
    delayMicroseconds(50);
    digitalWrite(STROBE, LOW);
    delayMicroseconds(50);

    Frequencies_One[freq_amp] = analogRead(DC_One);
    Frequencies_Two[freq_amp] = analogRead(DC_Two);
  }
}
The data is retrieved through the Graph_Frequencies() function. With this function, the RedBoard returns the analog value for the frequencies being read by the Spectrum Shield through the serial port.
language:c
/*****************Print Out Band Values for Serial Plotter*****************/
void Graph_Frequencies() {
  for (i = 0; i < 7; i++)
  {
//    Serial.print(Frequencies_One[i]);
//    Serial.print(" ");
//    Serial.print(Frequencies_Two[i]);
//    Serial.print(" ");
    Serial.print( (Frequencies_One[i] + Frequencies_Two[i]) / 2 );
    Serial.print("    ");
  }
  Serial.println();
}
Code Operation
With the sketch uploaded to your board, you are now able to analyze the different frequency bands of your audio input. Pull, up the Serial Monitor and set the baud rate to 9600. Then, using your computer play an audio sample. You should see the numbers in the columns of the Serial Monitor change with the audio.
Below, are some audio samples that users can use to test the Spectrum Shield:
- Online Tone Generator - a website based tone generator.
- Youtube Video - increases the (audio) signal frequency from 20 Hz to 20kHz.
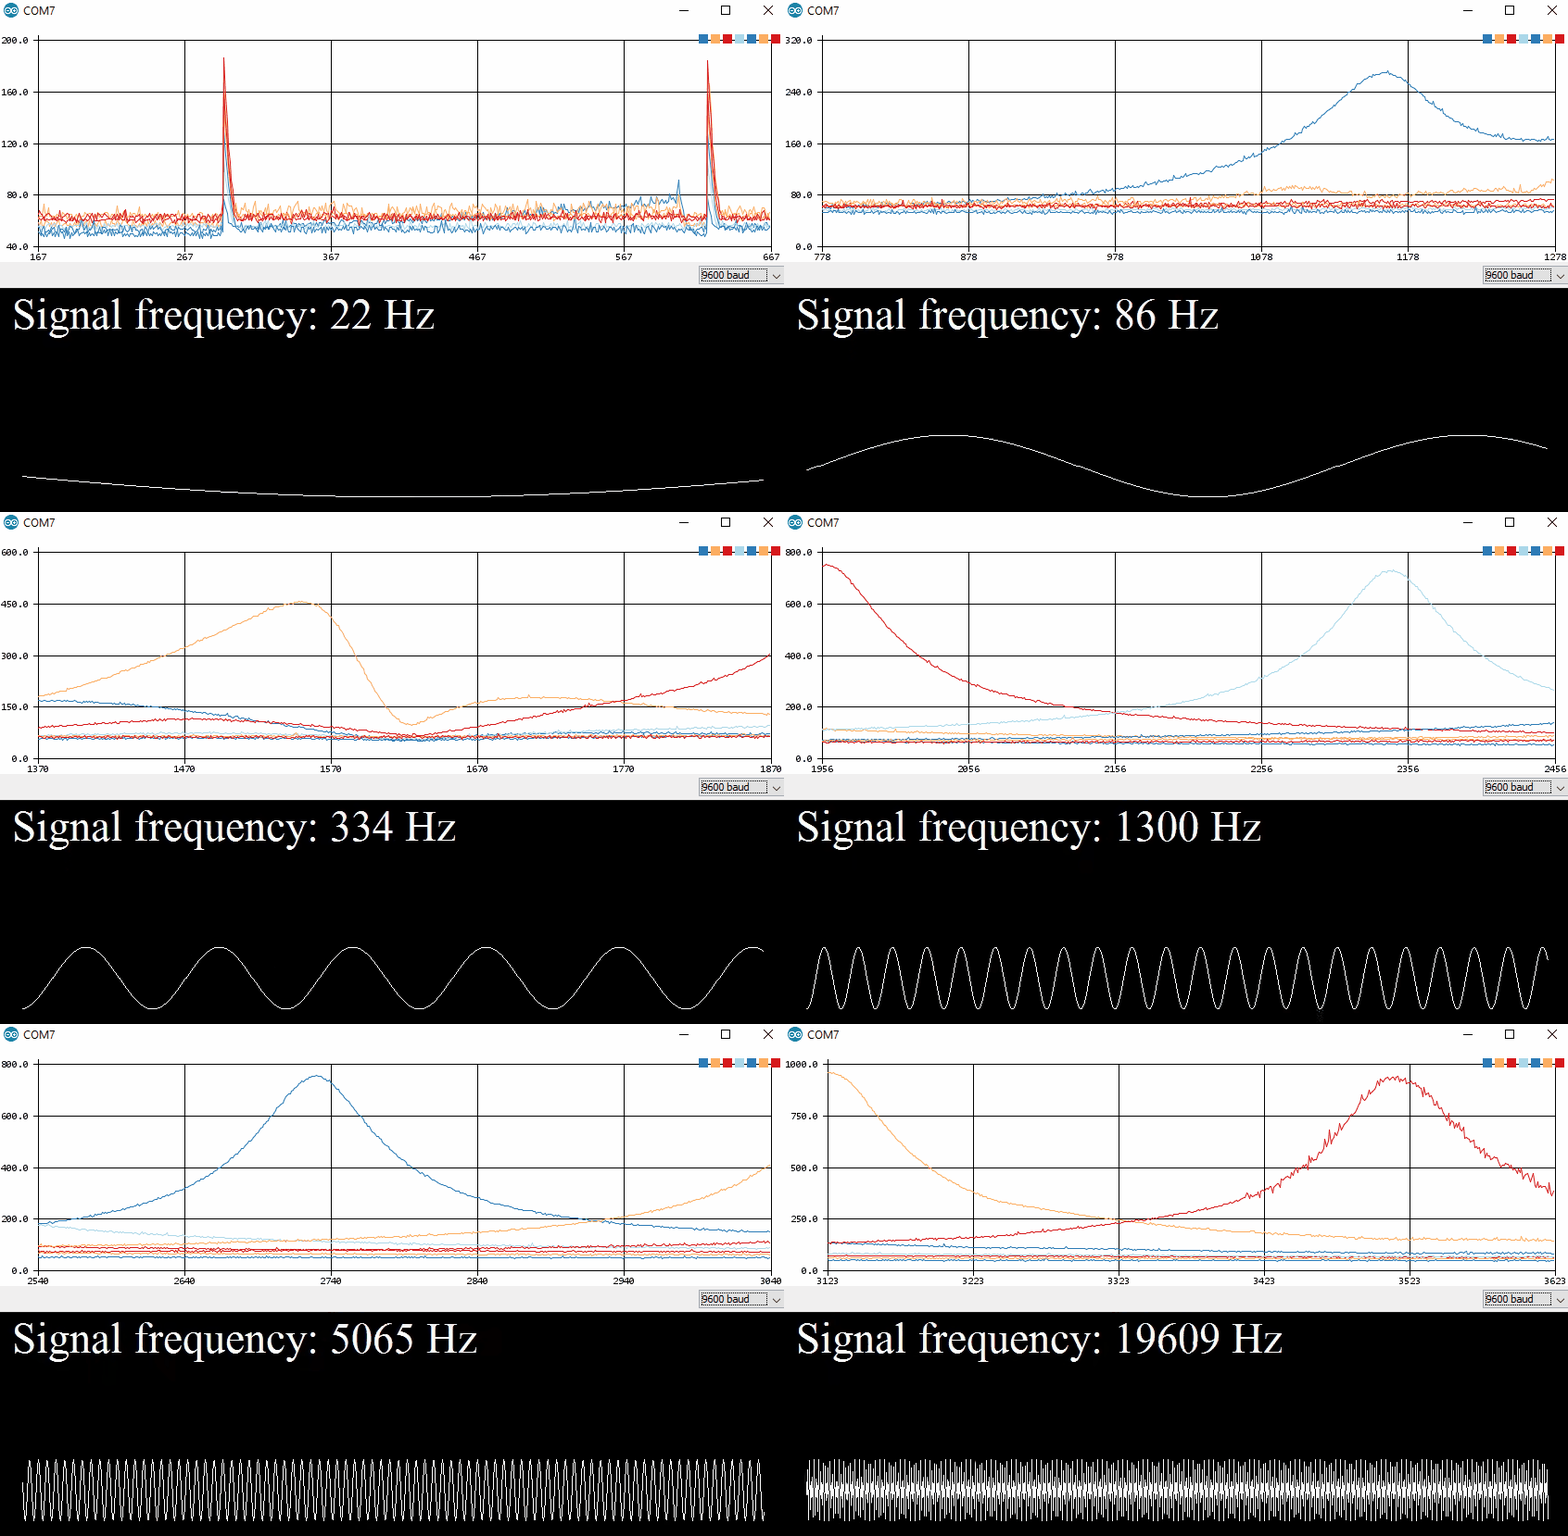
Try playing the Youtube video and using the Serial Plotter of the Arduino IDE. You should see a response curve similar to the one below. Notice how the shapes resemble the figure from the datasheet in the Hardware Overview section.
Additional Examples
There are plenty of projects out there using the Spectrum Shield, so do a bit of searching if you need some more inspiration! Additionally, you can refer to the original tutorial, which provides other examples including one from Bliptronics, the collaborator on the Spectrum Shield, which works with the Spectrum Shield and an LED matrix.
