Light
 SFUptownMaker
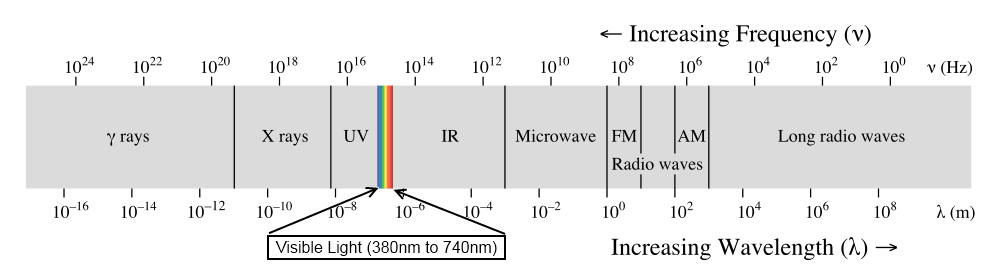
Visible Light
Visible light is light in the range of (approximately) 380nm to 740nm. This can vary; some people's eyes will be able to detect light of lower or higher wavelengths than this, but in general, most humans' eyes are sensitive to this region.
The Human Eye
There are two peculiarities in the way the human eye perceives light: our eyes are sensitive to different wavelengths in different amounts, and our eyes perceive light intensity logarithmically rather than linearly.
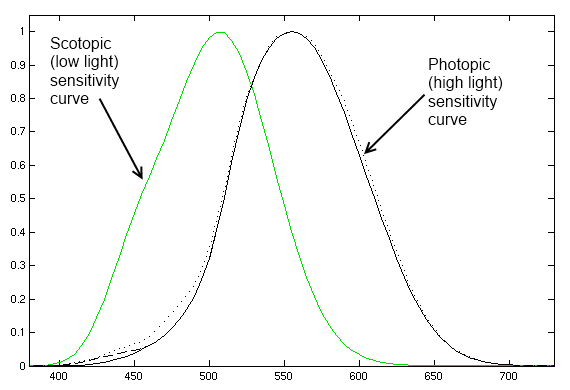
Perception of Color
As you can see on this chart, our eyes pick up different wavelengths of light with different efficiency, mixing the perceived intensities to yield what we refer to as a "color". Furthermore, you can also see that at low light levels, our perception of color becomes skewed.
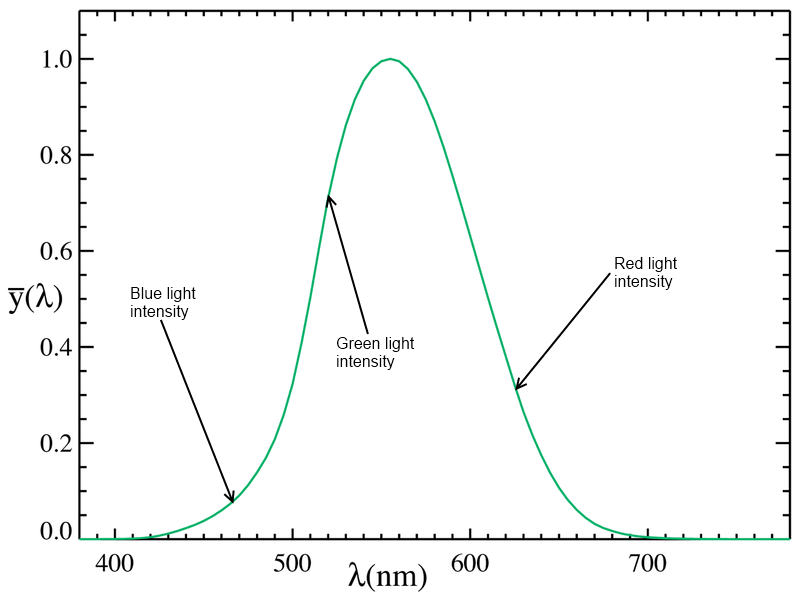
Because of this, a special unit of light intensity, the candela, was developed. The candela weights the intensity of a light source according to its color; a human eye will perceive a one-candela light source to be of similar brightness to another one-candela light source, regardless of wavelength. LED brightness is typically given in terms of millicandelas (mcd), and a great demonstration of the perceived intensity difference across colors can be seen when considering the intensity of an RGB LED such as this one: 800mcd for the red, 4000mcd for the green, and 900mcd for the blue. I've marked the wavelengths of those three colors (625nm, 520nm, and 467.5nm) on the chart below.
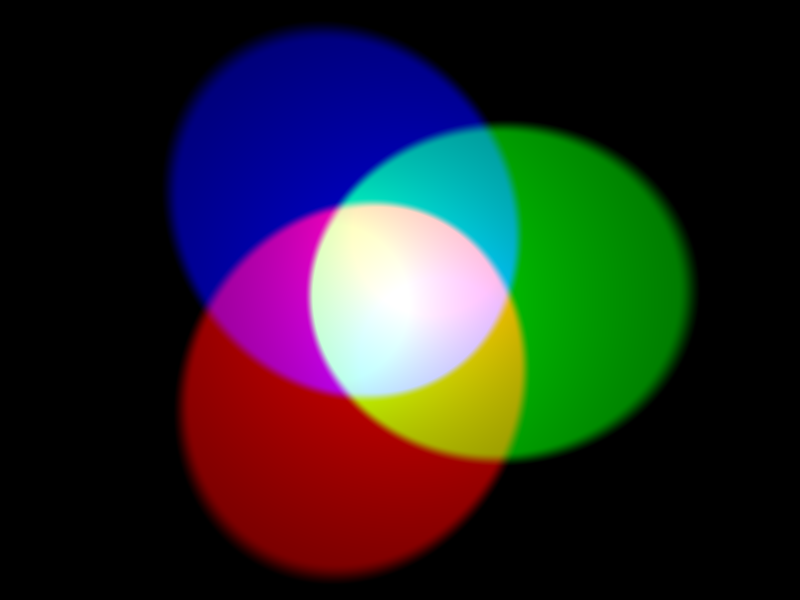
The eye can be fooled into detecting wavelengths of light that are not present by mixing different wavelengths; it is by this principle which most color displays work. Only three colors (some form of red, green, and blue) are actually available; by mixing those three light colors at different intensities, the vast majority of natural colors can be simulated (at least, as far as our eyes are concerned).
Perception of Intensity
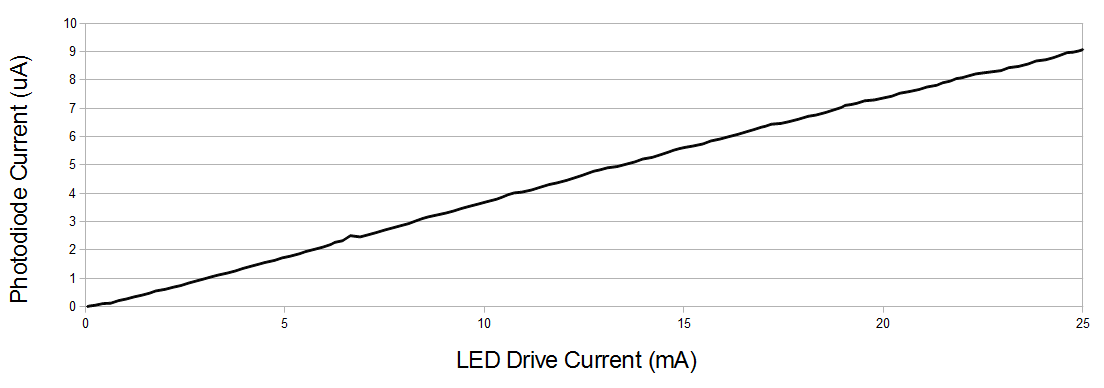
We naturally tend to think of light as a linear phenomenon. Given two light sources, we may reasonably perceive one to be twice as bright as the other. We've already seen how this can be affected by color; now let's consider the intensity of a light of a single color relative to our perception of it. The intensity of an LED varies linearly with the current being used to drive it.
Let's do a little experiment. If you have an Arduino, breadboard, resistor, LED, and a pushbutton, whip up this circuit, download the code, and throw the code onto the Arduino.

This circuit is pretty simple: push the button once, and the LED will turn on. Push it and hold it, and the LED will start to get brighter. Release it, and the LED will stop getting brighter and the Arduino will print out over the serial port how much brighter the LED was when you stopped it getting brighter than it was when it started. Try to stop the LED when it is twice as bright as it was when it started.
Why is it so hard? The light output of an LED is linear, so doubling the current through the LED doubles the amount of light energy it is emitting. However, your eye does not respond in a linear fashion, it responds logarithmically. The reason for this is simple: our eyes need to provide us with useful information across a full range of lighting conditions, from starlight to daylight. On a cloudless night under a full moon, the light intensity is only 1/440,000th that of a sunny day, yet our eyes must function well at both of those extremes and everywhere in between! That makes judging a linear light source's relative brightness very difficult.
Color blindness
Color blindness is not, as the name would suggest, a simple inability to perceive color. There are in fact many varieties of color blindness; the most common, red-green color blindness, affects almost 10% of the male population to some degree.
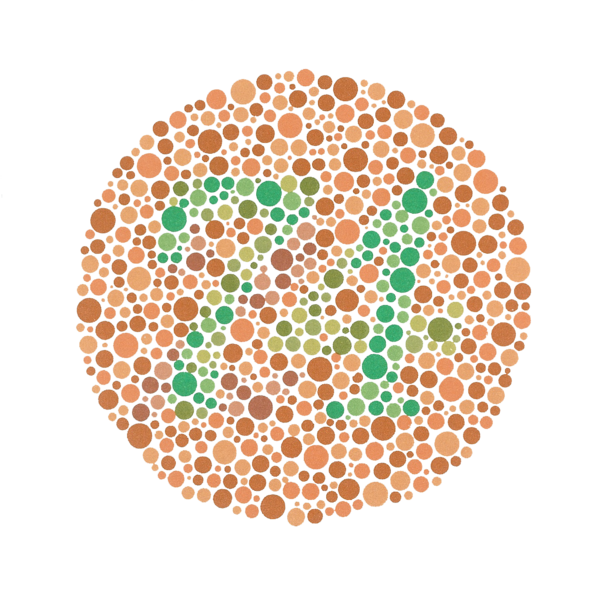
Color blindness can be diagnosed by a simple test, where the subject is asked to identify patterns or symbols created from dots of a different color against a background of similarly-sized dots.
As a kindness to those of us with color blindness, please try not to use color to convey information. Good examples of bad design include LEDs which change color to signify a condition (green means "okay", red means "failure"), maps using a range of colors to connect a numerical value to a region, and text colors other than white-on-black or black-on-white.