Turkey Scratch -- Thanksgiving, Programming, and a 'lil Data
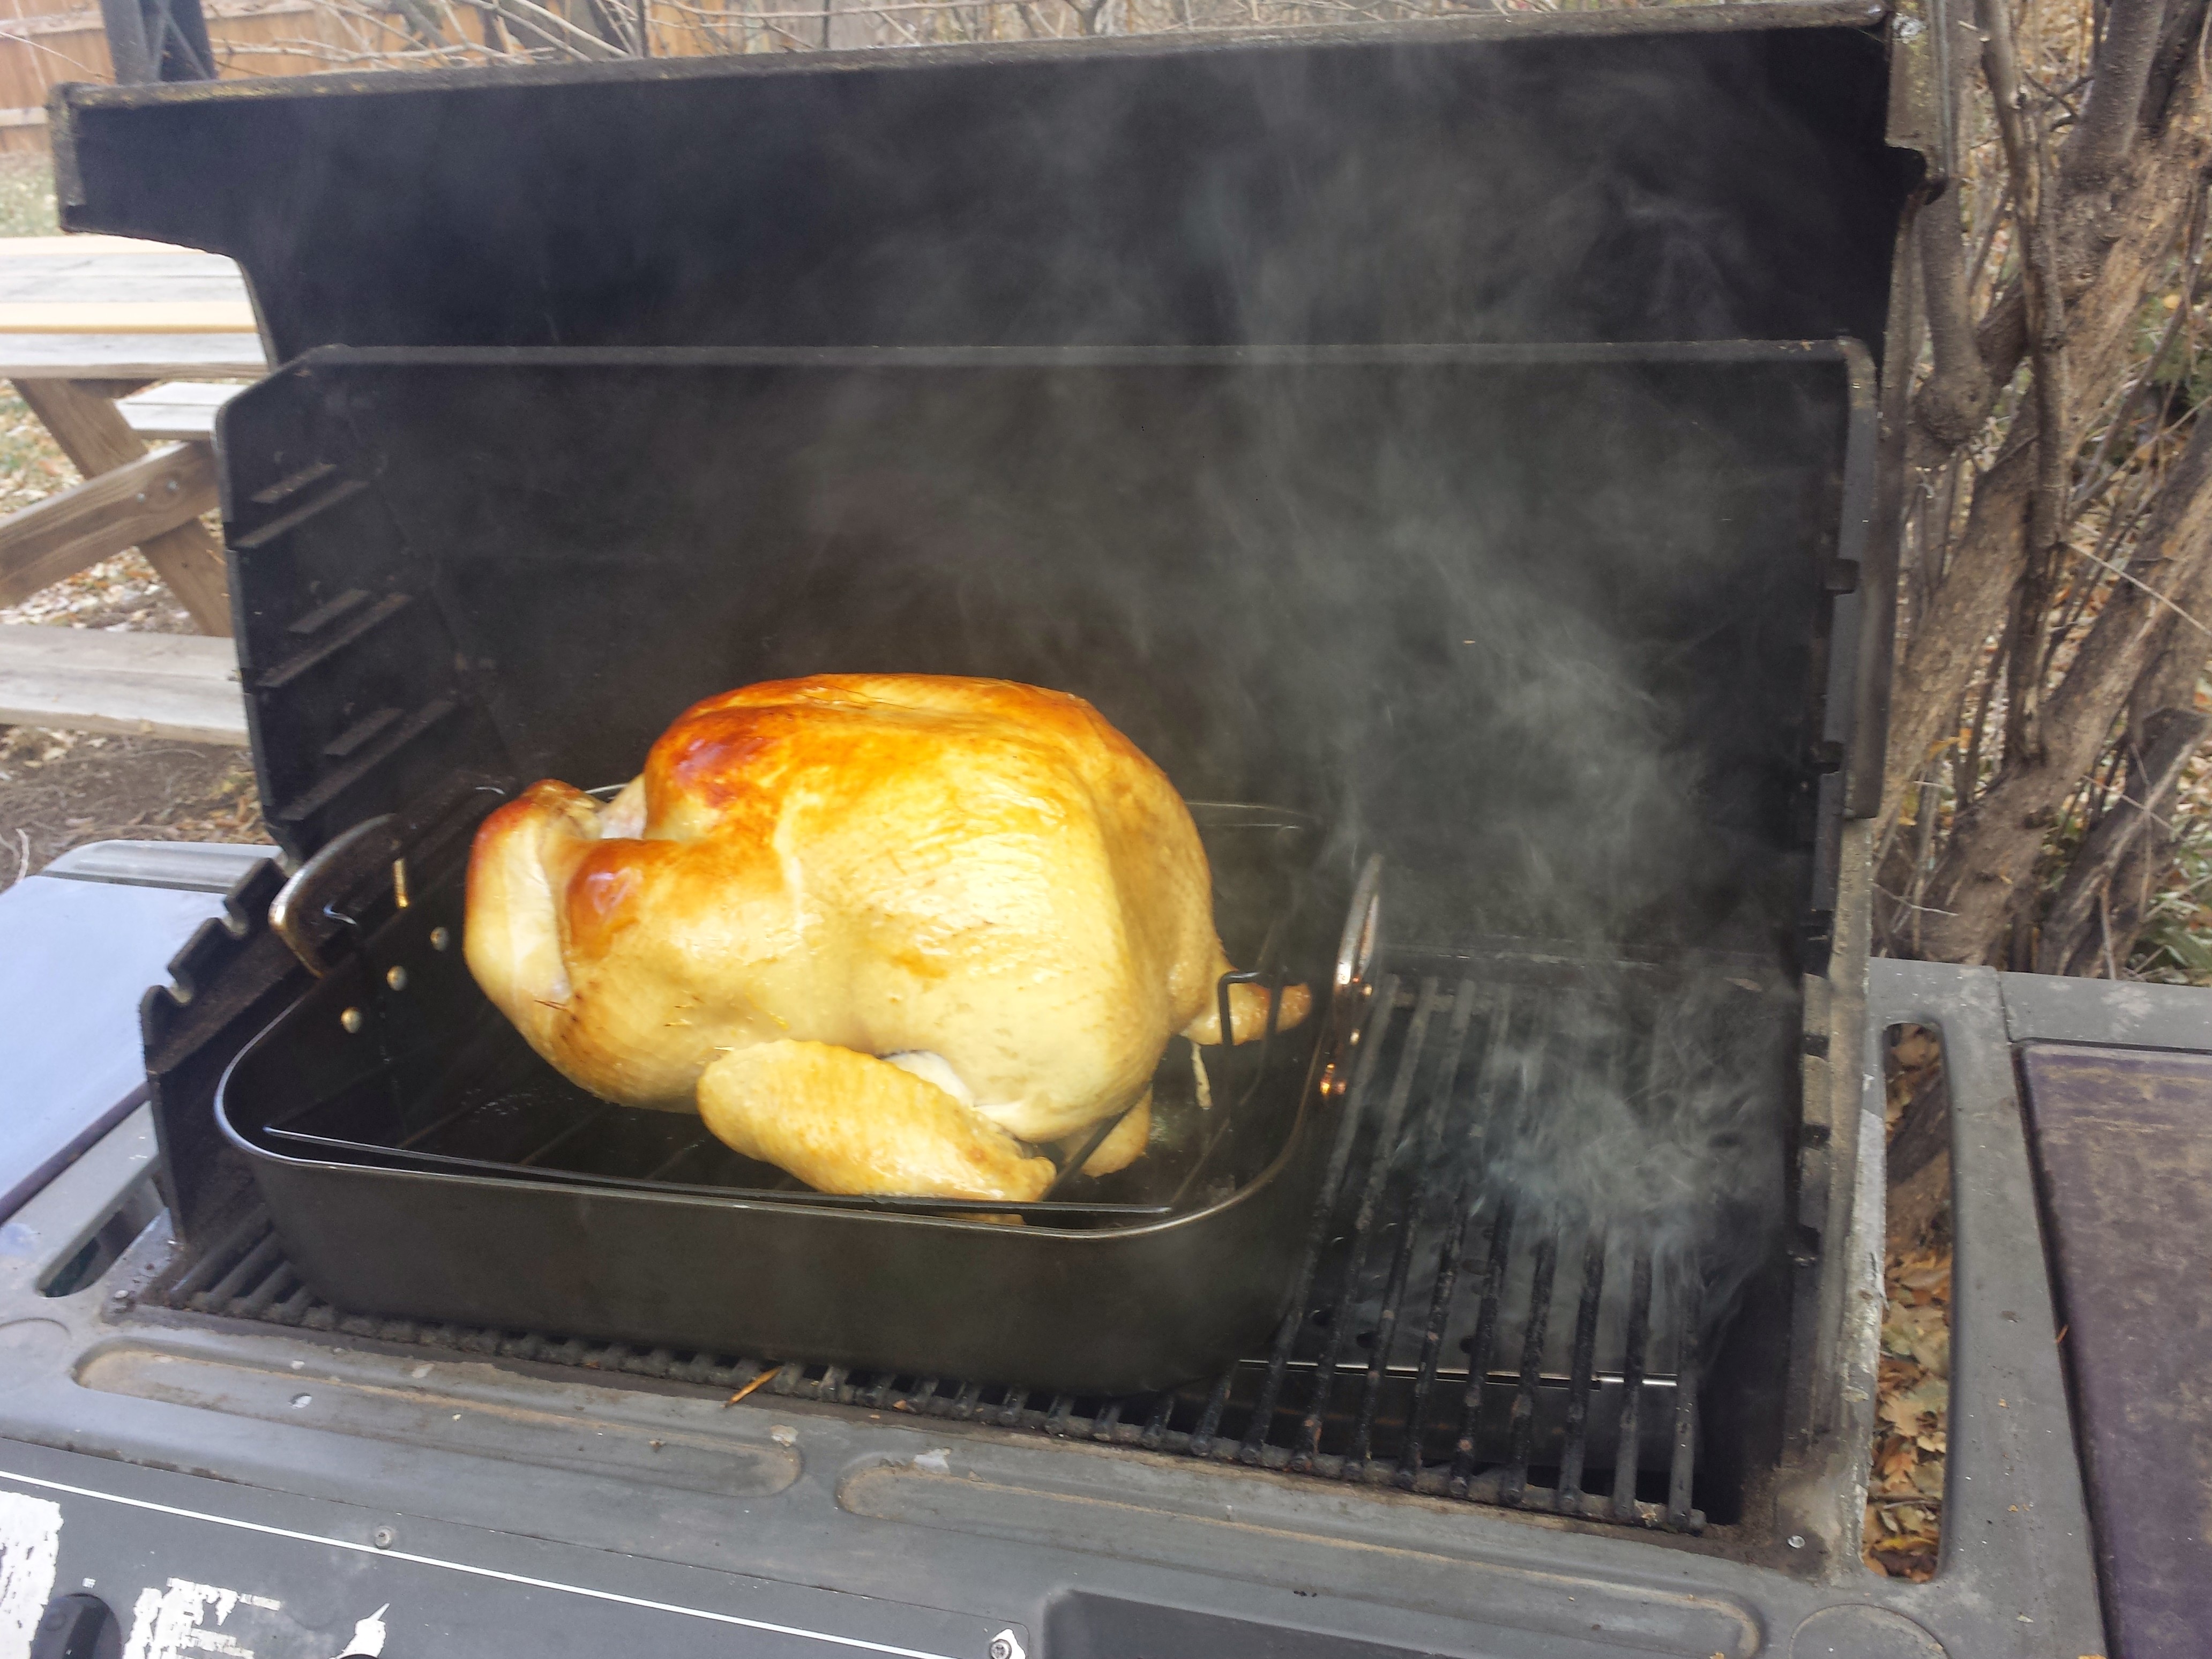
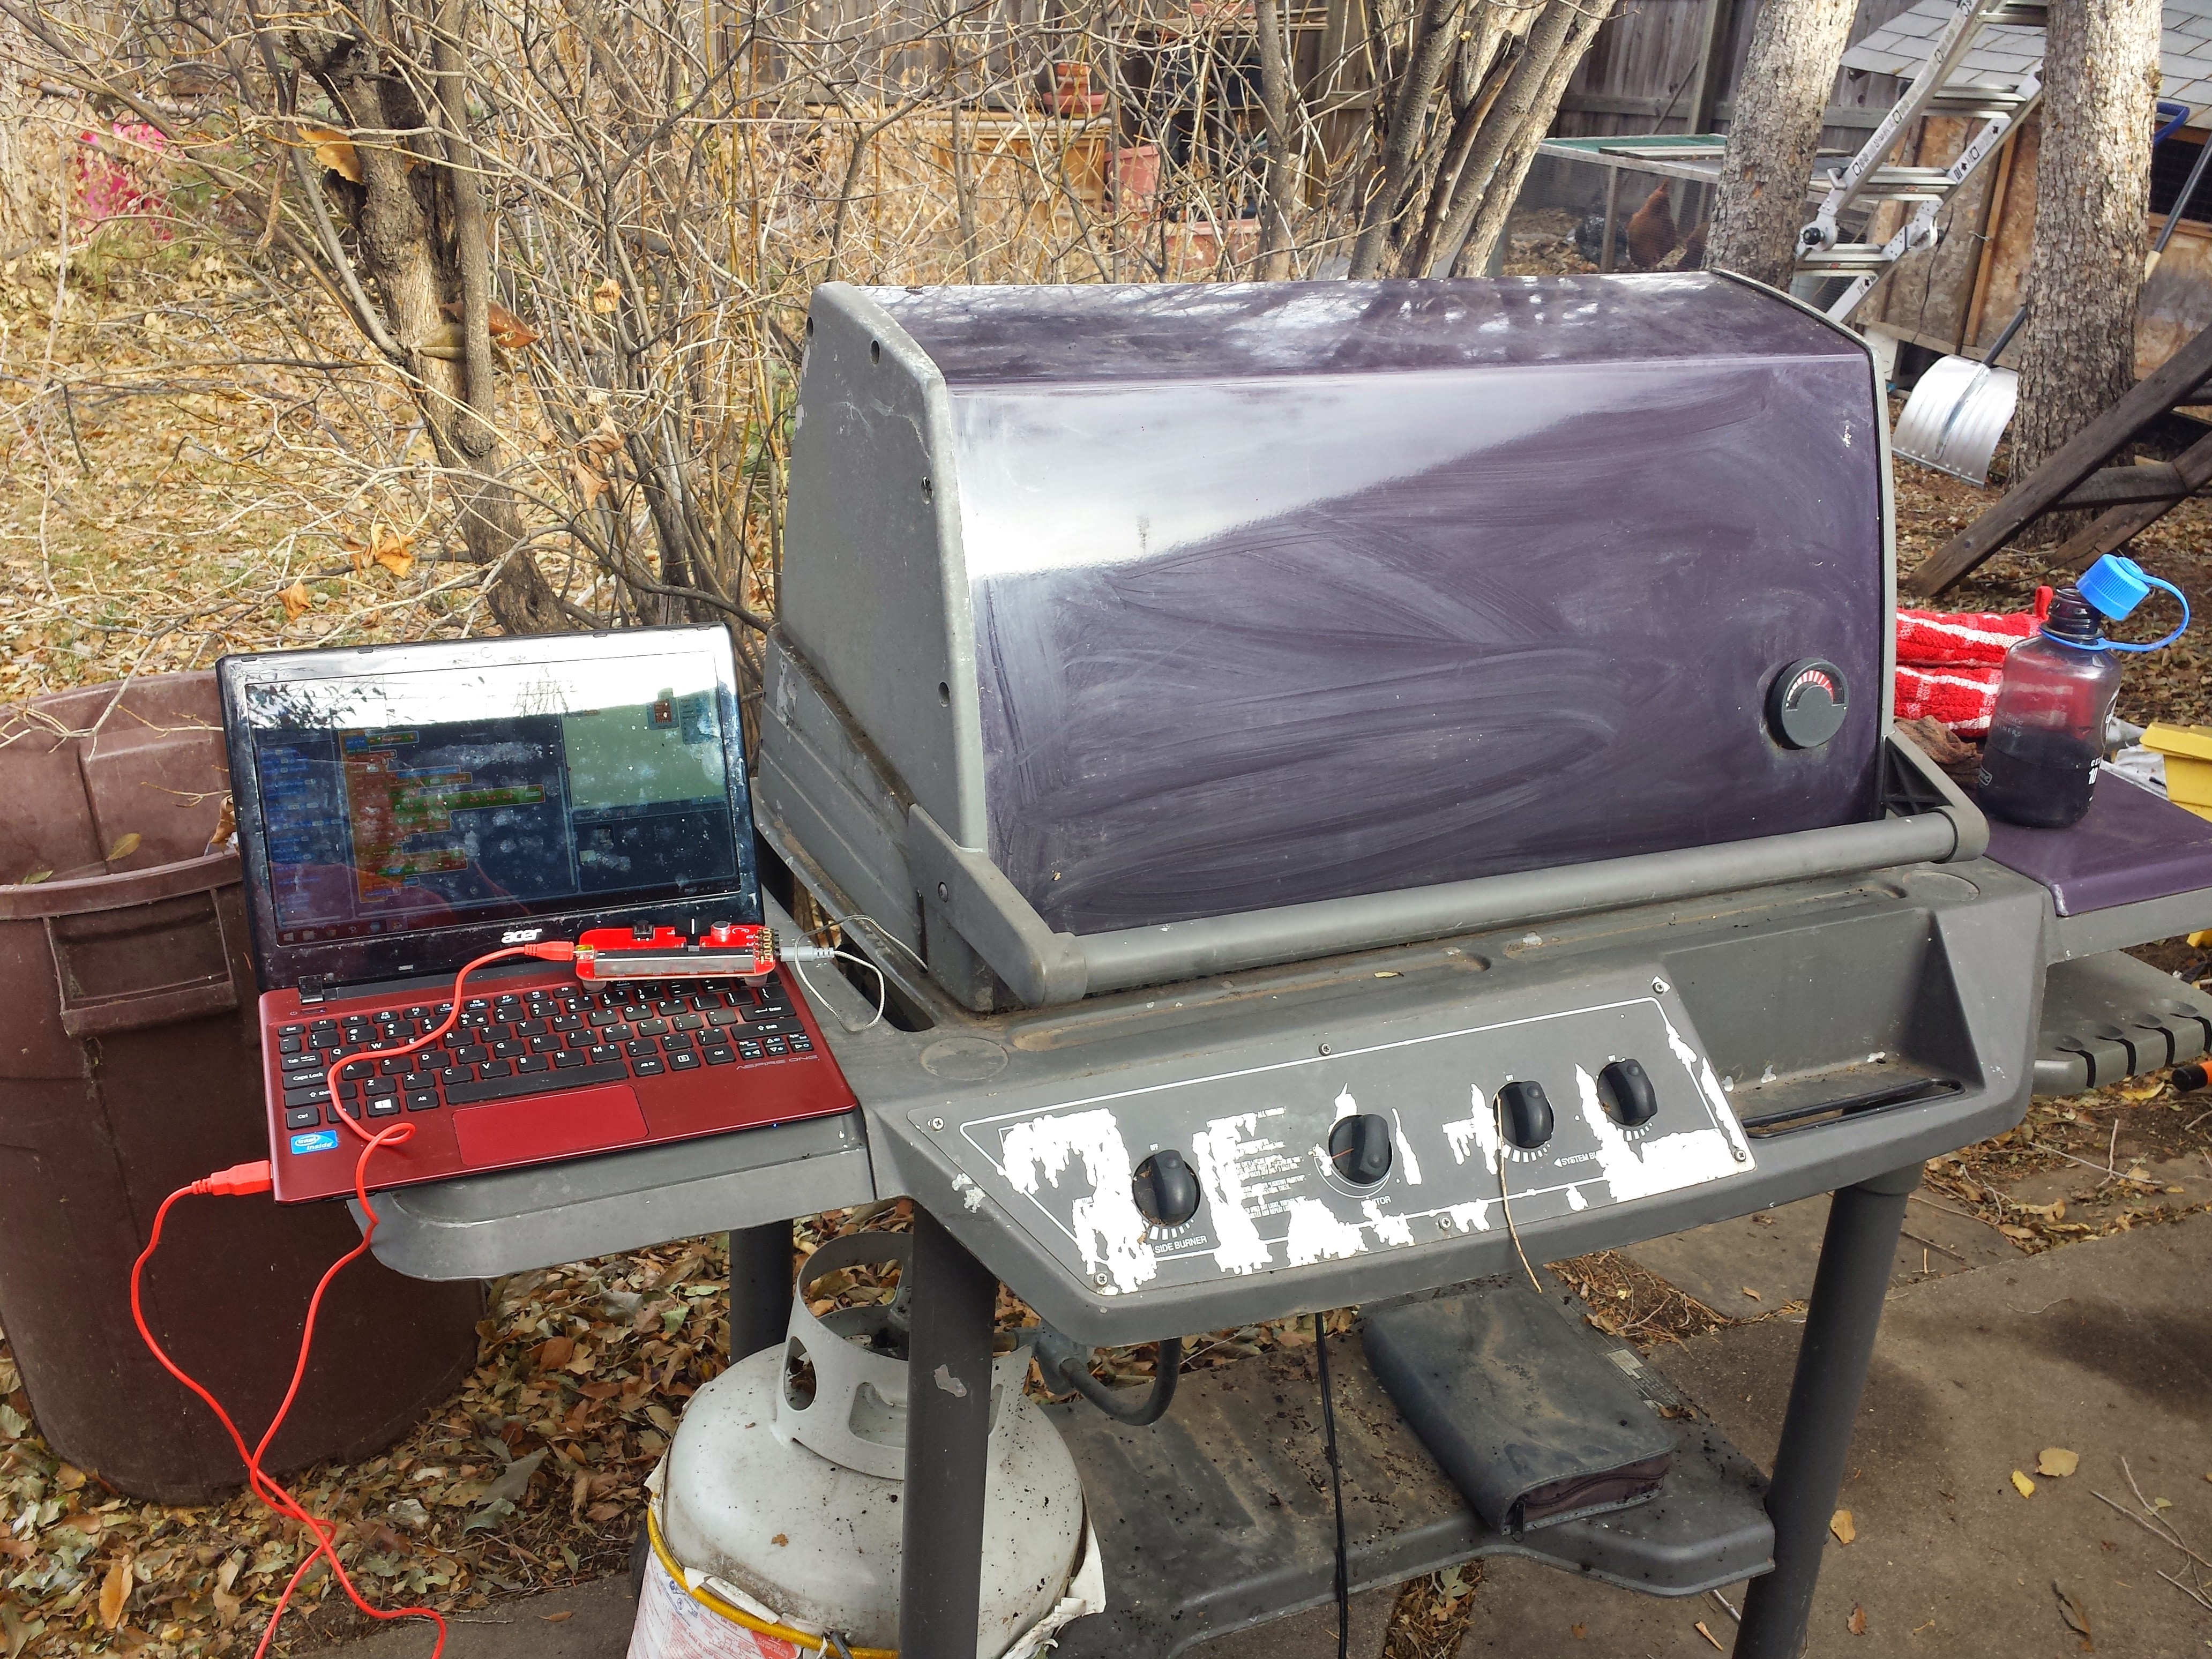
Happy Thanksgiving everyone! Check out this quick little hack using a standard temperature probe from my oven thermometer, our PicoBoard, and a little creative coding in Scratch!

Happy Thanksgiving everyone! A while back when I first started working with the PicoBoard, I couldn't help but notice that the 2.5 mm "audio" jacks on the side for auxiliary sensors were identical to the standard meat thermometers sold at your favorite kitchen supply store or places like Amazon. This Thanksgiving, I couldn't help but try and make my own Turkey Temperature Probe using Scratch and the PicoBoard.
-> 
 <-
<-
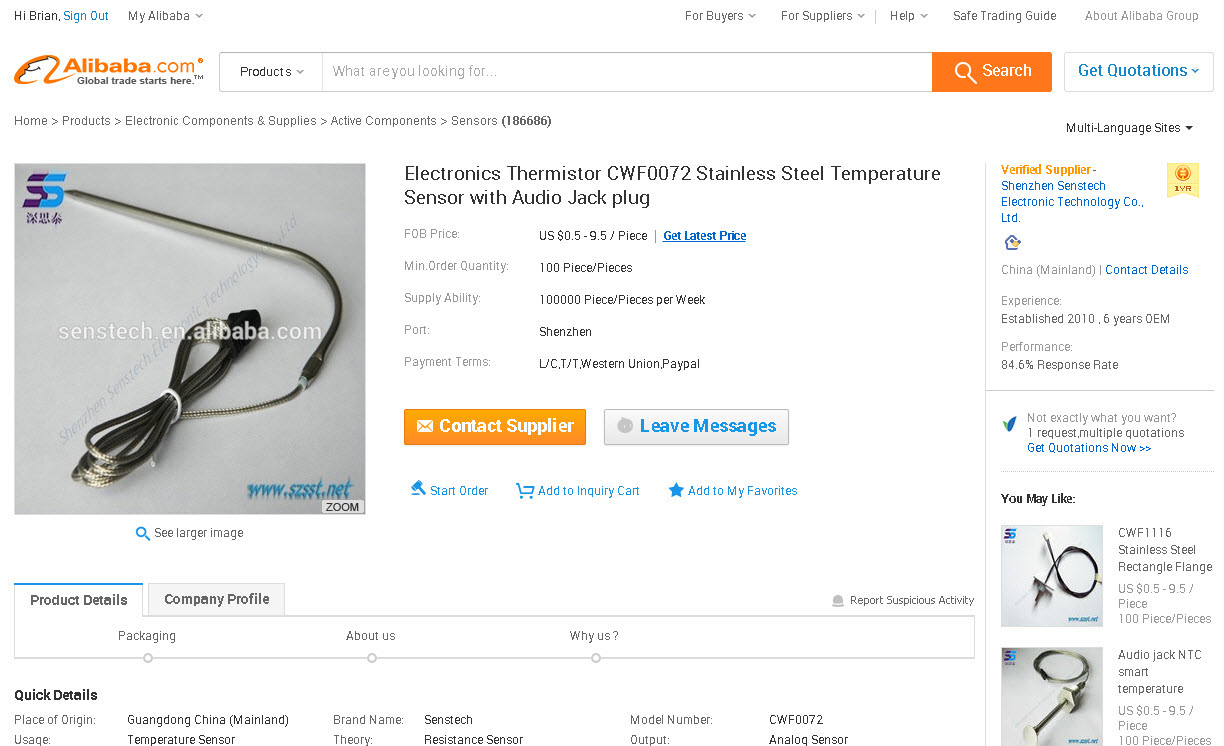
While you can go to a place like Bed, Bath, and Beyond and buy these probes -- I figured we could probably source these cheaper -- a quick search on-line, and we found a few suppliers on Alibaba and got a couple samples in.
From working on the tutorials for the Vernier Shield, I figured that the probe must be some kind of thermistor. One that probably could be approximated using the Steinhart-Hart equation. Unfortunately, we need the coefficients of the equation in order to use it.
With no datasheet for this probe, I figured there must be another way to find the coefficients. A quick search on-line for "steinhart hart coefficients calculator" resulted in this site from Stanford Research Systems (SRS) that performed a curve fit to three points of resistance and temperature.
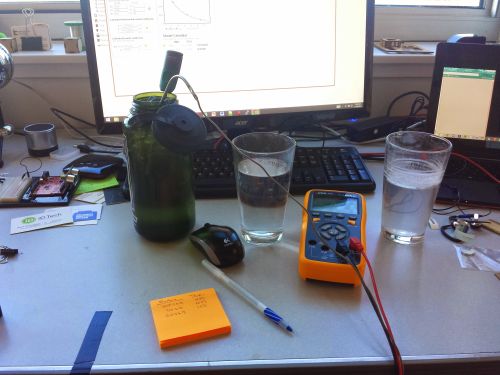
For this, I needed three known temperatures. I used a Vernier Go Wireless Temperature Probe that we received during one of our meetings / collaborations with Vernier. This thing is pretty sweet. It connects through Bluetooth to my phone and works seamlessly with Vernier's latest app.
Data
I used three glasses of water -- ice water, room temperature water, and hot water from our coffee machine. These resulted in the following data points:
| Temp (deg C) | Resistance (Ohms) | Notes\Memo |
| 1.9 | 627k | Ice water |
| 19.8 | 255.1k | Room Temperature water |
| 65.9 | 37k | Hot water |
And, using the Stanford Resarch Systems's Steinhart-Hart Coefficient Calculator:
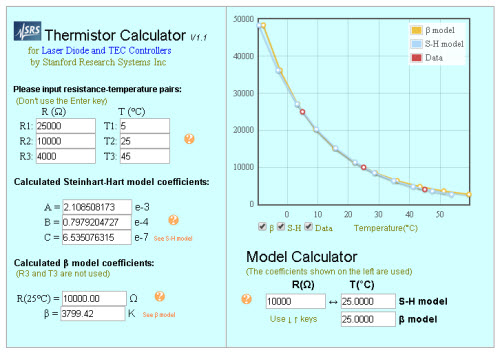
We found these coefficients for the Steinhart-Hart Equation:
k0 = 0.6150260350e-3
k1 = 2.147838217e-4
k2 = 0.6457281614e-7
Scratch
Now, for a few tricks in Scratch.
A little known feature of Scratch is that is supports many advanced math functions including all of the trig functions, logs, and inverse functions. I pulled together a few things and came up with this code:
Whoa! I know it looks like a lot, but it's really pretty simple. Take a minute to go through it and compare it to the standard Steinhart-Hart equation. Click here to download a copy of my code example.
This code assumes that the temperature probe is plugged into Port A of the PicoBoard. It measures the resistance across the thermistor - relative to the 10 k Ohm pull-up resistor that is on the PicoBoard. It applies the Steinhart-Hart Equation for converting the resistance of the thermistor to a temperature.
To smooth our the data, this code averages 5000 measurements and graphs this onto the screen. It also saves this data to a list variable that can be used for data analysis in Matlab, Excel, or your favorite data crunching tool. Pretty cool, huh?
Your turn!
So, next Thanksgiving - or the next time you roast something in the oven and want to do a little data collection / analysis - give my example code a try with our PicoBoard. And, let us know how it goes! We always love seeing pictures of your projects!


That's awesome. Thanks Christian! I agree that more points would probably give a better curve fit. There was a time when I would have used Matlab for this -- but, man - python and the scipy library is pretty slick! Thank you for sharing this! What I love is that this is using Scratch (a pretty simple and easy to use programming language) and extending beyond what most people use it for.
If I had to name the most important tool I learned to use in my time in university/science, it'd be "curve fitting" of model parameters to experimental data. And while it's really nice and convenient to have a web-frontend, sometimes you want to learn the more general approach.
Python (numpy, scipy) has an excellent library for that: scipy.optimize.
Scipy Documentation scipy.optimize.curve_fit
And while your 3 measurements are exactly the right number to get the three parameters of the Steinhart Hart equation, I'd really do two or three additional measurements the next time. (e.g. wait until your "hot" water has cooled a little bit, and your "ice" water has warmed up a little bit...). That way you can verify if the curve shape matches your data also in-between.
Here's a quick example on how to do it with your thermistor:
Sample code on pastebin QrMUe1hN