Python is generally more popular as a sequential programming language that is called from the command line interface (CLI). However, several frameworks exist that offer the ability to create slick graphical user interfaces (GUI) with Python. Combined with a single board computer, like the Raspberry Pi, this ability to build GUIs opens up new possibilities to create your own dashboard for watching metrics, explore virtual instrumentation (like LabVIEW), or make pretty buttons to control your hardware.
In this tutorial, we'll go through the basics of Tkinter (pronounced "Tee-Kay-Inter", as it's the "TK Interface" framework), which is the default GUI package that comes bundled with Python. Other frameworks exist, such as wxPython, PyQt, and Kivy. While some of these might be more powerful, Tkinter is easy to learn, comes with Python, and shares the same open source license as Python.
Later in the tutorial, we'll show how to control various pieces of hardware from a Tkinter GUI and then how to pull a Matplotlib graph into an interface. The first part of the tutorial (Tkinter basics) can be accomplished on any computer without special hardware. The parts that require controlling hardware or reading from a sensor will be shown on a Raspberry Pi.
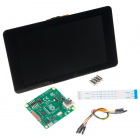
To work through the activities in this tutorial, you will need a few pieces of hardware:
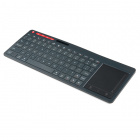
You have several options when it comes to working with the Raspberry Pi. Most commonly, the Pi is used as a standalone computer, which requires a monitor, keyboard, and mouse (listed below). To save on costs, the Pi can also be used as a headless computer (without a monitor, keyboard, and mouse).
Note that for this tutorial, you will need access to the Raspbian (or other Linux) graphical interface (known as the desktop). As a result, the two recommended ways to interact with your Pi is through a monitor, keyboard, and mouse or by using Virtual Network Computing (VNC).
Before diving in to Tkinter and connecting hardware, you'll need to install and configure a few pieces of software. You can work through the first example with just Python, but you'll need a Raspberry Pi for the other sections that involve connecting hardware (we'll be using the RPi.GPIO and SMBus packages).
Tkinter comes with Python. If Python is installed, you will automatically have access to the the Tkinter package.
Follow the steps outlined in the Prepare Your Pi section of the Graph Sensor Data with Python and Matplotlib tutorial to install Raspbian and configure Python 3. You will only need to perform the last "Install Dependencies" step if you plan to replicate the final example in this guide (integrating Matplotlib with Tkinter).
If you aren't familiar with the following concepts, we recommend checking out these tutorials before continuing:
Let's start with a basic example. If you don't have a Raspberry Pi, you can install Python on your computer to run this demo and the "Temperature Converter" experiment.
Copy the following into a new file. Save it, and give it a name like tkinter_hello.py.
language:python
import tkinter as tk
# Create the main window
root = tk.Tk()
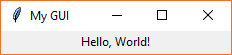
root.title("My GUI")
# Create label
label = tk.Label(root, text="Hello, World!")
# Lay out label
label.pack()
# Run forever!
root.mainloop()
Run the program from the command line with python tkinter_hello.py. You should see a new window pop up with the phrase "Hello, World!" If you expand the window, you should see the phrase "My GUI" set in the title bar (you might have to expand the window to see it).
Let's break down the relatively simple program. In the first line,
language:python
import tkinter as tk
we import the Tkinter module and shorten the name to tk. We do this to save us some typing in the rest of the code: we just need to type tk instead of tkinter.
In other Tkinter guides, you might see the import written as from tkinter import *. This says to import all classes, functions, and variables from the Tkinter package into the global space. While this might make typing easier (e.g. you would only need to type Tk() instead of tk.Tk()), it has the downside of cluttering your global workspace. In a larger application, you would need to keep track of all these global variables in your head, which can be quite difficult! For example, Tkinter has a variable named E (which we'll see in a later example), and it's much easier to remember that you mean Tkinter's version of E (rather than E from another module) by having to write tk.E.
Next, we create a root window by calling Tkinter's constructor, tk.Tk().
language:python
root = tk.Tk()
This automatically creates a graphical window with the necessary title bar, minimize, maximize, and close buttons (the size and location of these are based on your operating system's preferences). We save a handle to this window in the variable root. This handle allows us to put other things in the window and reconfigure it (e.g. size) as necessary. For example, we can change the name in the title bar by calling the title method in the root window:
language:python
root.title("My GUI")
In this window, we can add various control elements, known as widgets. Widgets can include things like buttons, labels, text entry boxes, and so on. Here, we create a Label widget:
language:python
label = tk.Label(root, text="Hello, World!")
Notice that when we create any widget, we must pass it a reference to its parent object (the object that will contain our new widget). In this example, we want the root window to be the parent object of our label (i.e. root will own your label object). We also set the default message in the label to be the classic "Hello, World!"
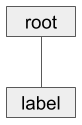
When it comes to creating GUIs with Tkinter, it's generally a good idea to create your widgets first and then lay out your widgets together within the same hierarchy. In this example, root is at the top of our hierarchy followed by our label object under that.
After creating our label, we lay it out using the pack() geometry manager.
language:python
label.pack()
A geometry manager is a piece of code that runs (as part of the Tkinter framework--we don't see the backend parts) to organize our widgets based on criteria that we set. pack() just tells the geometry manager to put widgets in the same row or column. It's usually the easiest to use if you just want one or a few widgets to appear (and not necessarily be nicely organized).
Finally, we tell Tkinter to start running:
language:python
root.mainloop()
Note that if we don't call mainloop(), nothing will appear on our screen. This method says to take all the widgets and objects we created, render them on our screen, and respond to any interactions (such as button pushes, which we'll cover in the next example). When we exit out of the main window (e.g. by pressing the close window button), the program will exit out of mainloop().
This section is meant to give you an overview of the "building blocks" that are available in Tkinter and is in no way a complete list of classes, functions, and variables. The official Python docs and TkDocs offer a more comprehensive overview of the Tkinter package. Examples will be discussed in more details throughout this tutorial, but feel free to refer back to these reference tables as you build your own application.
A widget is a controllable element within the GUI, and all Tkinter widgets have a shared set of methods. The Tkinter guide on effbot.org offers an easy-to-read reference for the core widget methods (these are the methods that all widgets have access to, regardless of which individual widget you might be using).
The following table shows all the core widgets with an example screenshot. Click on the widget name to view its reference documentation from effbot.org.
| Widget | Description | Example |
|---|---|---|
| Button | Clickable area with text that calls an associated function whenever the user clicks in the area. | 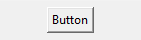 |
| Canvas | General purpose widget that can display simple graphics or provide an area to implement a custom widget. | 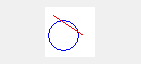 |
| Checkbutton | Allows a user to read and select between two distinct values (e.g. on/off). Also known as a "checkbox." |  |
| Entry | Area that allows the user to enter one line of text. For entering multiple lines, use the Text widget. |  |
| Frame | A container for other widgets. A Frame can be useful for grouping other widgets together in a complex layout. |  |
| Label | Used to display text or an image that may not be edited by the user. |  |
| LabelFrame | A rectangular area that contains other widgets, but unlike a Frame, a border and label may be added to help group widgets together. | 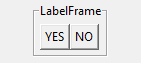 |
| Listbox | Displays a list of text alternatives. The user can choose (highlight) one or more options. | 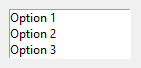 |
| Menu | Used to create menus and submenus within an interface. Can be used to create the always-shown "menu bar" popular in many GUI applications. | 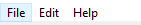 |
| Menubutton | Obsolete as of Tk 8.0. Use Menu widget instead. | See Menu |
| Message | Used to display static text, like Label, but allows for multiple lines, text wrapping, and maintaining aspect ratios. |  |
| OptionMenu | Drop-down (or pop-up) menu that allows users to select one option from several options. | 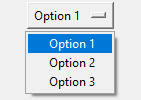 |
| PanedWindow | Container for one or more widgets split into multiple "panes." These panes can be resized by the user by dragging the serparator line(s) (known as "sashes"). |  |
| Radiobutton | Several Radiobuttons can be used together to allow the user to select one option out of a group of options. |  |
| Scale | User can select a numerical value by moving a slider. |  |
| Scrollbar | Paired with a Canvas, Entry, Listbox, or Text widget to allow for scrolling within that widget. |  |
| Spinbox | Allows the user to select only one option out of a list of options. |  |
| Text | Area used to display and edit multiple lines of text. Can be used as a full text editor by the user. |  |
| Toplevel | A container for other widgets (much like the Frame widget) that appears in its own window. It can be useful for creating other application windows or pop-up notifications. |  |
The code below was used to create the example widgets in the above table. Note that they are for demonstration purposes only, as much of the functionality has not been implemented (e.g. no functions for button pushes).
language:python
import tkinter as tk

# Create the main window
root = tk.Tk()
root.title("My GUI")

# Create a set of options and variable for the OptionMenu
options = ["Option 1", "Option 2", "Option 3"]
selected_option = tk.StringVar()
selected_option.set(options[0])

# Create a variable to store options for the Radiobuttons
radio_option = tk.IntVar()

###############################################################################
# Create widgets

# Create widgets
button = tk.Button(root, text="Button")
canvas = tk.Canvas(root, bg='white', width=50, height=50)
checkbutton = tk.Checkbutton(root, text="Checkbutton")
entry = tk.Entry(root, text="Entry", width=10)
frame = tk.Frame(root)
label = tk.Label(root, text="Label")
labelframe = tk.LabelFrame(root, text="LabelFrame", padx=5, pady=5)
listbox = tk.Listbox(root, height=3)
menu = tk.Menu(root)
# Menubutton: deprecated, use Menu instead
message = tk.Message(root, text="Message", width=50)
optionmenu = tk.OptionMenu(root, selected_option, *options)
panedwindow = tk.PanedWindow(root, sashrelief=tk.SUNKEN)
radiobutton_1 = tk.Radiobutton( root,
                                text="Option 1",
                                variable=radio_option,
                                value=1)
radiobutton_2 = tk.Radiobutton( root,
                                text="Option 2",
                                variable=radio_option,
                                value=2)
scale = tk.Scale(root, orient=tk.HORIZONTAL)
scrollbar = tk.Scrollbar(root)
spinbox = tk.Spinbox(root, values=(0, 2, 4, 10))
text = tk.Text(root, width=15, height=3)
toplevel = tk.Toplevel()

# Lay out widgets
button.pack(padx=5, pady=5)
canvas.pack(padx=5, pady=5)
checkbutton.pack(padx=5, pady=5)
entry.pack(padx=5, pady=5)
frame.pack(padx=5, pady=10)
label.pack(padx=5, pady=5)
labelframe.pack(padx=5, pady=5)
listbox.pack(padx=5, pady=5)
# Menu: See below for adding the menu bar at the top of the window
# Menubutton: deprecated, use Menu instead
message.pack(padx=5, pady=5)
optionmenu.pack(padx=5, pady=5)
panedwindow.pack(padx=5, pady=5)
radiobutton_1.pack(padx=5)
radiobutton_2.pack(padx=5)
scale.pack(padx=5, pady=5)
scrollbar.pack(padx=5, pady=5)
spinbox.pack(padx=5, pady=5)
text.pack(padx=5, pady=5)
# Toplevel: does not have a parent or geometry manager, as it is its own window

###############################################################################
# Add stuff to the widgets (if necessary)

# Draw something in the canvas
canvas.create_oval(5, 15, 35, 45, outline='blue')
canvas.create_line(10, 10, 40, 30, fill='red')

# Add a default value to the Entry widgets
entry.insert(0, "Entry")

# Create some useless buttons in the LabelFrame
button_yes = tk.Button(labelframe, text="YES")
button_no = tk.Button(labelframe, text="NO")

# Lay out buttons in the LabelFrame
button_yes.pack(side=tk.LEFT)
button_no.pack(side=tk.LEFT)

# Put some options in the Listbox
for item in ["Option 1", "Option 2", "Option 3"]:
    listbox.insert(tk.END, item)

# Add some options to the menu
menu.add_command(label="File")
menu.add_command(label="Edit")
menu.add_command(label="Help")

# Add the menu bar to the top of the window
root.config(menu=menu)

# Create some labels to add to the PanedWindow
label_left = tk.Label(panedwindow, text="LEFT")
label_right = tk.Label(panedwindow, text="RIGHT")

# Add the labels to the PanedWindow
panedwindow.add(label_left)
panedwindow.add(label_right)

# Put some default text into the Text widgets
text.insert(tk.END, "I am a\nText widget")

# Create some widgets to put in the Toplevel widget (window)
top_label = tk.Label(toplevel, text="A Toplevel window")
top_button = tk.Button(toplevel, text="OK", command=toplevel.destroy)

# Lay out widgets in the Toplevel pop-up window
top_label.pack()
top_button.pack()

###############################################################################
# Run!

root.mainloop()
Just instantiating (creating) a widget does not necessarily mean that it will appear on the screen (with the exception of Toplevel(), which automatically creates a new window). To get the widget to appear, we need to tell the parent widget where to put it. To do that, we use one of Tkinter's three geometery managers (also known as layout managers).
A geometry manager is some code that runs on the backend of Tkinter (we don't interact with the geometry managers directly). We simply choose which geometry manager we want to use and give it some parameters to work with.
The three geometry managers are: grid, pack, and place. You should never mix geometry managers within the same hierarchy, but you can embed different managers within each other (for example, you can lay out a frame widget with grid in a Toplevel and then use pack to put different widgets within the frame).
Here is a table showing examples of the different geometry managers:
| Manager | Description | Example |
|---|---|---|
| Grid | The grid manager places widgets in a table format with rows and columns. It will avoid overlapping widgets and will resize rows/columns as necessary to fit the widgets. | 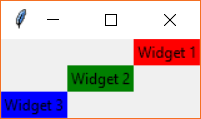 |
| Pack | Pack is often the easiest geometry manager to use, as it just puts widgets in a single row or column (default). It "packs" the widgets by putting them side-by-side (or top-to-bottom). | 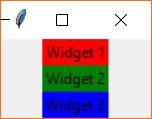 |
| Place | The place geometry manager offers the most control but can be the most difficult to use. It allows you to specify the absolute or relative positions of the widgets in a window (or parent widget). | 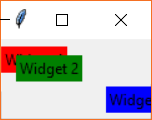 |
The code below was used to create the examples shown in the above table. Note that it creates 3 windows (1 with the Tk() constructor call and 2 others with Toplevel()) and uses different geometry managers to lay out 3 widgets in each.
language:python
import tkinter as tk

###############################################################################
# Grid layout example

# Create the main window (grid layout)
root = tk.Tk()
root.title("Grid")

# Create widgets
label_grid_1 = tk.Label(root, text="Widget 1", bg='red')
label_grid_2 = tk.Label(root, text="Widget 2", bg='green')
label_grid_3 = tk.Label(root, text="Widget 3", bg='blue')

# Lay out widgets in a grid
label_grid_1.grid(row=0, column=2)
label_grid_2.grid(row=1, column=1)
label_grid_3.grid(row=2, column=0)

###############################################################################
# Pack layout example

# Create another window for pack layout
window_pack = tk.Toplevel()
window_pack.title("Pack")

# Create widgets
label_pack_1 = tk.Label(window_pack, text="Widget 1", bg='red')
label_pack_2 = tk.Label(window_pack, text="Widget 2", bg='green')
label_pack_3 = tk.Label(window_pack, text="Widget 3", bg='blue')

# Lay out widgets with pack
label_pack_1.pack()
label_pack_2.pack()
label_pack_3.pack()

###############################################################################
# Place layout example

# Create another window for pack layout
window_place = tk.Toplevel()
window_place.title("Place")

# Create widgets
label_place_1 = tk.Label(window_place, text="Widget 1", bg='red')
label_place_2 = tk.Label(window_place, text="Widget 2", bg='green')
label_place_3 = tk.Label(window_place, text="Widget 3", bg='blue')

# Lay out widgets with pack
label_place_1.place(relx=0, rely=0.1)
label_place_2.place(relx=0.1, rely=0.2)
label_place_3.place(relx=0.7, rely=0.6)

###############################################################################
# Run!

root.mainloop()
If you want to dynamically change a widget's displayed value or text (e.g. change the text in a Label), you need to use one of Tkinter's Variables. This is because Python has no way of letting Tkinter know that a variable has been changed (known as tracing). As a result, we need to use a wrapper class for these variables.
Each Tkinter Variable has a get() and set() method so you can read and change with the Variable's value. This page also gives you a list of other methods available to each Variable. You must choose the appropriate Variable for the values you plan to work with, and this table shows you which Variables you have available:
| Manager | Description | Examples |
|---|---|---|
| BooleanVar | Works with Boolean values. | True, False |
| DoubleVar | Works with floating point values. | -68.0, 2.718281 |
| IntVar | Works with integer values. | -3, 0, 42 |
| StringVar | Works with strings. | "Hello", "world!" |
If you want to see this in action, run the following code:
language:python
import tkinter as tk

# Declare global variables
counter = None

# This function is called whenever the button is pressed
def count():

    global counter

    # Increment counter by 1
    counter.set(counter.get() + 1)

# Create the main window
root = tk.Tk()
root.title("Counter")

# Tkinter variable for holding a counter
counter = tk.IntVar()
counter.set(0)

# Create widgets (note that command is set to count and not count() )
label_counter = tk.Label(root, width=7, textvariable=counter)
button_counter = tk.Button(root, text="Count", command=count)

# Lay out widgets
label_counter.pack()
button_counter.pack()

# Run forever!
root.mainloop()
You should see a window appear with a number and button. Try pressing the button a few times to watch the number increment.
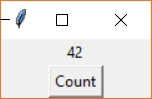
In the program, we create a button that calls the count() function whenever it is pressed. We also create an IntVar named counter and set its initial value to 0. Take a look at where we create the label:
language:python
label_counter = tk.Label(root, width=7, textvariable=counter)
You'll notice that we assign our IntVar (counter) to the textvariable parameter. This tells Tkinter that whenever the counter variable is changed, the Label widget should automatically update its displayed text. This saves us from having to write a custom loop where we manually update all the displayed information!
From here, all we need to do is worry about updating the counter variable each time the button is pressed. In the count() function, we do that with:
language:python
counter.set(counter.get() + 1)
Notice that we can't get the IntVar's value by the normal means, and we can't set it with the equals sign (=). We need to use the get() and set() methods, respectively.
Before we connect any hardware, it can be helpful to try a more complicated example to get a feel for laying out a GUI and using Tkinter to build your vision. We'll start with a simple example: a Celsius-to-Fahrenheit temperature converter.
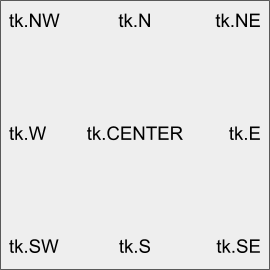
Before writing any code, pull out a piece of paper and a pencil (or dry erase board and marker). Sketch out how you want your GUI to look: where should labels go? Do you want text entry fields at the top or the bottom? Should you have a "Quit" button, or let the user click the window's "Close" button?
Here is what I came up with for our simple converter application. Note that we can divide it into a simple 3x3 grid, as shown by the red lines (more or less--we might need to nudge some of the widgets to fit into their respective cells).
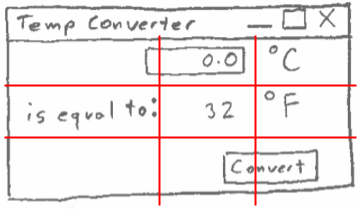
As a result, we can determine that using the grid manager would be the best for this layout.
Copy the following code into your Python editor.
language:python
import tkinter as tk

# Declare global variables
temp_c = None
temp_f = None

# This function is called whenever the button is pressed
def convert():

    global temp_c
    global temp_f

    # Convert Celsius to Fahrenheit and update label (through textvariable)
    try:
        val = temp_c.get()
        temp_f.set((val * 9.0 / 5) + 32)
    except:
        pass

# Create the main window
root = tk.Tk()
root.title("Temperature Converter")

# Create the main container
frame = tk.Frame(root)

# Lay out the main container, specify that we want it to grow with window size
frame.pack(fill=tk.BOTH, expand=True)

# Allow middle cell of grid to grow when window is resized
frame.columnconfigure(1, weight=1)
frame.rowconfigure(1, weight=1)

# Variables for holding temperature data
temp_c = tk.DoubleVar()
temp_f = tk.DoubleVar()

# Create widgets
entry_celsius = tk.Entry(frame, width=7, textvariable=temp_c)
label_unitc = tk.Label(frame, text="°C")
label_equal = tk.Label(frame, text="is equal to")
label_fahrenheit = tk.Label(frame, textvariable=temp_f)
label_unitf = tk.Label(frame, text="°F")
button_convert = tk.Button(frame, text="Convert", command=convert)

# Lay out widgets
entry_celsius.grid(row=0, column=1, padx=5, pady=5)
label_unitc.grid(row=0, column=2, padx=5, pady=5, sticky=tk.W)
label_equal.grid(row=1, column=0, padx=5, pady=5, sticky=tk.E)
label_fahrenheit.grid(row=1, column=1, padx=5, pady=5)
label_unitf.grid(row=1, column=2, padx=5, pady=5, sticky=tk.W)
button_convert.grid(row=2, column=1, columnspan=2, padx=5, pady=5, sticky=tk.E)

# Place cursor in entry box by default
entry_celsius.focus()

# Run forever!
root.mainloop()
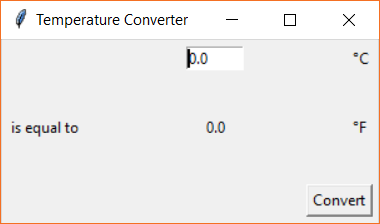
Give it a name like tkinter_temp_converter.py, and run it. You should see a new window appear with an area to type in a number (representing degrees Celsius). Press the "Convert" button, and the equivalent temperature in Fahrenheit should appear in the label next to "°F."

Let's break down some of the code we saw in the previous example. After importing Tkinter, we define our convert() function. This is a callback, as we pass the function as an argument to our button, and Tkinter calls our function whenever a button press event occurs (i.e. we never call convert() directly).
While not completely necessary, you'll notice that we declared temp_c and temp_f as global variables, as we want to be able to access them from within the function, and they were not passed in as parameters. Additionally, you'll see that we calculate temp_f within a try/except block. If the user enters a string (instead of numbers), our conversion will fail, so we just tell Python to ignore the exception and don't perform any calculation on the incorrectly typed data.
The next thing we do is create a frame within our main window and use the fill and expand parameters to allow it to grow with the window size.
language:python
# Create the main container
frame = tk.Frame(root)

# Lay out the main container, specify that we want it to grow with window size
frame.pack(fill=tk.BOTH, expand=True)
In our previous examples, we had been placing our widgets directly in the main window. This is generally not considered good practice, so we pack a frame within the window first, and then put our widgets within the frame. By doing this, we can more easily control how the widgets behave when we resize the window.
Before creating our widgets, we tell the frame that it should expand with the window if the user resizes it:
language:python
# Allow middle cell of grid to grow when window is resized
frame.columnconfigure(1, weight=1)
frame.rowconfigure(1, weight=1)
Note that because we used the pack() manager for the frame, we must tell column/rowconfigure that the location of the cell is (1, 1). If were were using these methods with a grid() manager, we could specify different rows and columns. The weight parameter tells the geometry manager how it should resize the given row/column proportionally to all the others. By setting this to 1 for each configure method, we're telling Tkinter to just resize the whole frame to fill the window. To learn more, see the Handling Resize section of this TkDocs article.
After that, we create our Tkinter Variables, temp_c and temp_f and create all of our widgets that belong in the frame. Note that we assign our convert() function to our button with command=convert parameter assignment. By doing this, we tell Tkinter that we want to call the convert() function whenever the button is pressed.
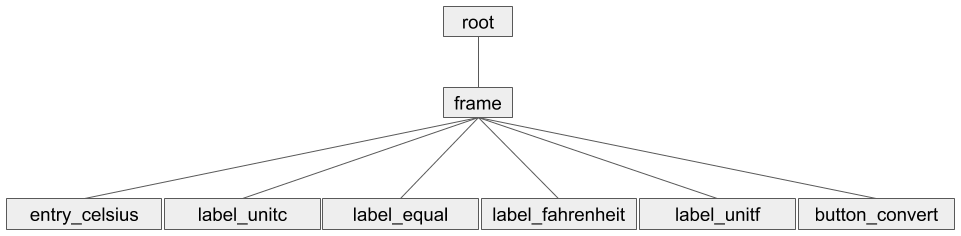
We then lay out each of the widgets using the grid geometry manager. We go through each widget and assign it to a cell location. There is nothing in the top-left cell (0, 0), so we leave it blank. We put the text entry widget in the next column over (0, 1) followed by the units (0, 2). We replicate this process for the next row (row 1) with the label for "is equal to," the solution, and the units for Fahrenheit. Finally, we add the convert button to the bottom-right. However, because the button is wider than the unit labels, we have it take up two cells: (2, 1) and (2, 2). We do that with columnspan=2, which works like the "merge" command in most modern spreadsheet programs.
Note that in some of the .grid() layout calls, we use the sticky parameter. This tells the geometry manager how to put the widget in its cell. By default (i.e. not using sticky), the widget will be centered within the cell. tk.W says that the widget should be left-aligned in its cell, and tk.E says it should be right-alighted. You can use the following anchor constants to align your widget:
Finally, before running our mainloop, we tell Tkinter that the Entry box should have focus.
language:python
# Place cursor in entry box by default
entry_celsius.focus()
This places the cursor in the entry box so the user can immediately begin typing without having to click on the Entry widget.
Let's connect some hardware! If you want to dig deeper into user interface design, a book on design theory, like this one, might be a good place to start. By controlling hardware, we can begin to connect GUI design to the real world. Want to make your own Nest-style thermostat? This is a good place to start.
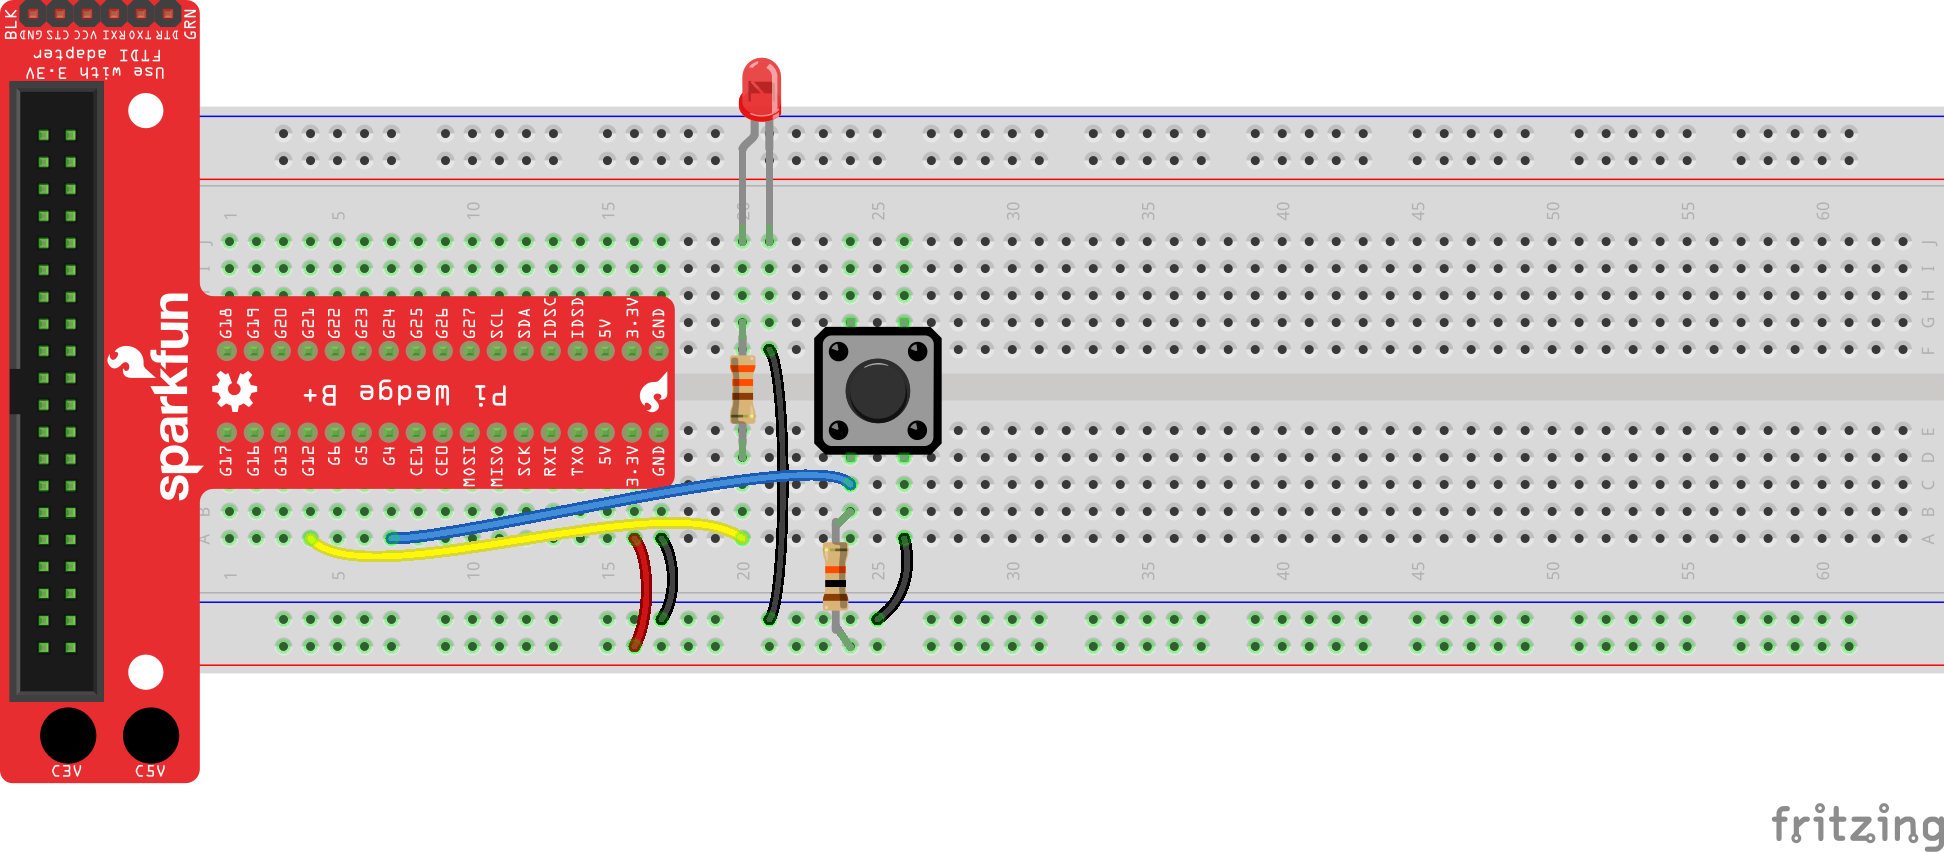
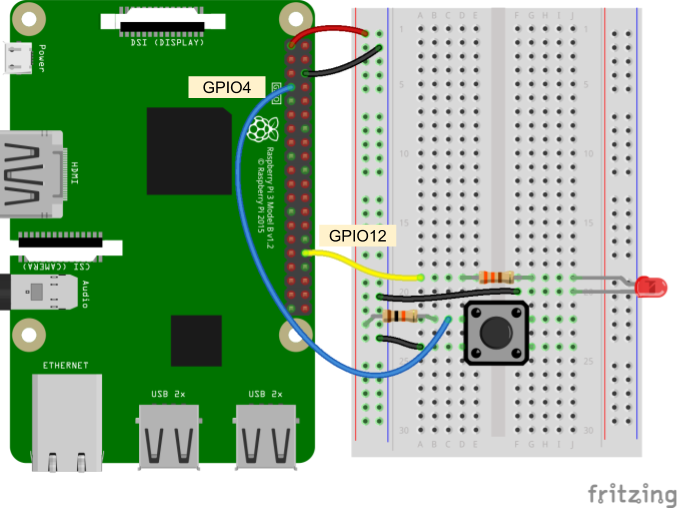
We'll start with a few basic examples that show how to control an LED and respond to a physical button push. Connect the LED, button, and resistors as shown in the diagrams.
If you have a Pi Wedge, it can make connecting to external hardware on a breadboard easier. If you don't, you can still connect directly to the Raspberry Pi with jumper wires.
Connecting through a Pi Wedge:
Connecting directly to the Raspberry Pi:
Depending on your version of Raspbian, the RPi.GPIO package may or may not be already installed (e.g. Raspbian Lite does not come with some Python packages pre-installed). In a terminal, enter the following:
language:bash
pip install rpi.gpio
Copy the following code into a new file:
language:python
import tkinter as tk
from tkinter import font

import RPi.GPIO as GPIO

# Declare global variables
button_on = None
button_off = None

# Pin definitions
led_pin = 12

# This gets called whenever the ON button is pressed
def on():

    global button_on
    global button_off

    # Disable ON button, enable OFF button, and turn on LED
    button_on.config(state=tk.DISABLED, bg='gray64')
    button_off.config(state=tk.NORMAL, bg='gray99')
    GPIO.output(led_pin, GPIO.HIGH)

# This gets called whenever the OFF button is pressed
def off():

    global button_on
    global button_off

    # Disable OFF button, enable ON button, and turn off LED
    button_on.config(state=tk.NORMAL, bg='gray99')
    button_off.config(state=tk.DISABLED, bg='gray64')
    GPIO.output(led_pin, GPIO.LOW)

# Use "GPIO" pin numbering
GPIO.setmode(GPIO.BCM)

# Set LED pin as output and turn it off by default
GPIO.setup(led_pin, GPIO.OUT)
GPIO.output(led_pin, GPIO.LOW)

# Create the main window
root = tk.Tk()
root.title("LED Switch")

# Create the main container
frame = tk.Frame(root)

# Lay out the main container
frame.pack()

# Create widgets
button_font = font.Font(family='Helvetica', size=24, weight='bold')
button_on = tk.Button(frame, text="ON", width=4, command=on,
                        state=tk.NORMAL, font=button_font, bg='gray99')
button_off = tk.Button(frame, text="OFF", width=4, command=off,
                        state=tk.DISABLED, font=button_font, bg='gray64')

# Lay out widgets
button_on.grid(row=0, column=0)
button_off.grid(row=1, column=0)

# Run forever!
root.mainloop()

# Neatly release GPIO resources once window is closed
GPIO.cleanup()
Save your file with a name like tkinter_switch.py and run it with python tkinter_switch.py. You should see a new window pop up with two buttons: ON and OFF. OFF should be grayed out, so try pressing ON. The LED should turn on and OFF should now be the only available button to press. Press it, and the LED should turn off. This is the software version of a light switch!

Code to Note:
In the on() and off() function definitions, we enable and disable the buttons by using the .config() method. For example:
language:python
button_on.config(state=tk.DISABLED, bg='gray64')
button_off.config(state=tk.NORMAL, bg='gray99')
.config() allows us to dynamically change the attributes of widgets even after they've been created. In our switch example, we change their state and bg (background color) to create the effect of the switch being active or "grayed out."
You might also notice that we use the font module within Tkinter to create a custom font for the buttons. This allows us to change the typeface as well as make the font bigger and bolder. We then assign this new font to the buttons' text with font=button_font.
At the end of the code, we place the following line after our root.mainloop():
language:python
GPIO.cleanup()
This line tells Linux to release the resources it was using to handle all the pin toggling that we were doing after we close the main window. Without this line, we would get a warning next time we ran the program (or tried to use the RPi.GPIO module).
Since we proved we can turn an LED on and off, let's try dimming it. In fact, let's make a virtual dimmer switch! In a new file, copy in the following code:
language:python
import tkinter as tk

import RPi.GPIO as GPIO

# Declare global variables
pwm = None

# Pin definitions
led_pin = 12

# This gets called whenever the scale is changed--change brightness of LED
def dim(i):

    global pwm

    # Change the duty cycle based on the slider value
    pwm.ChangeDutyCycle(float(i))

# Use "GPIO" pin numbering
GPIO.setmode(GPIO.BCM)

# Set LED pin as output
GPIO.setup(led_pin, GPIO.OUT)

# Initialize pwm object with 50 Hz and 0% duty cycle
pwm = GPIO.PWM(led_pin, 50)
pwm.start(0)

# Create the main window and set initial size
root = tk.Tk()
root.title("LED Dimmer")
root.geometry("150x300")

# Create the main container
frame = tk.Frame(root)

# Lay out the main container (center it in the window)
frame.place(relx=0.5, rely=0.5, anchor=tk.CENTER)

# Create scale widget
scale = tk.Scale(   frame,
                    orient=tk.VERTICAL,
                    from_=100,
                    to=0,
                    length=200,
                    width=50,
                    sliderlength=50,
                    showvalue=False,
                    command=dim )

# Lay out widget in frame
scale.pack()

# Run forever!
root.mainloop()

# Stop, cleanup, and exit when window is closed
pwm.stop()
GPIO.cleanup()
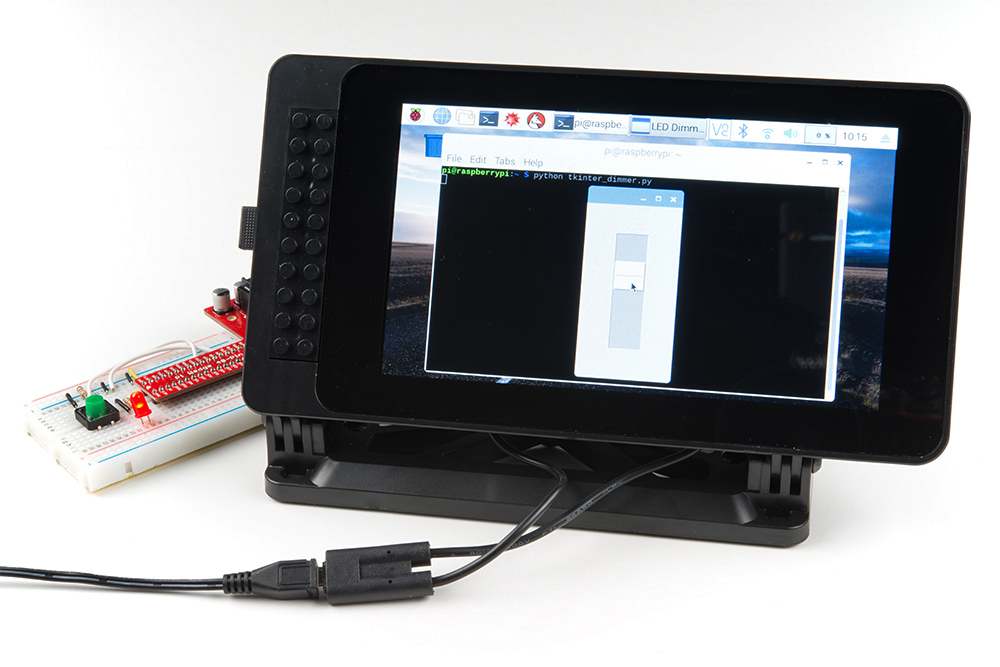
Give the file a name like tkinter_dimmer.py and run it. You should see a Scale widget pop up in a new window. Try sliding it, and you should see the attached LED get brighter.
Code to Note:
When constructing our Scale widget, we need to set a good number of attributes:
language:python
scale = tk.Scale(   frame,
                    orient=tk.VERTICAL,
                    from_=100,
                    to=0,
                    length=200,
                    width=50,
                    sliderlength=50,
                    showvalue=False,
                    command=dim )
By default, scales appear horizontally, so we use orient=tk.VERTICAL to have it work like a dimmer switch you might find in a house. Next, the Scale will count from 0 to 100 by default, but 0 will be at the top (in the vertical orientation). As a result, we swap the from_ and to parameters so that 0 starts at the bottom. Also, notice that from_ has an underscore after it; from is a reserved keyword in Python, so Tkinter had to name it something else. We use 0 through 100, as those are the acceptable values for the pwm.ChangeDutyCycle() method parameter.
We can adjust the size and shape of the Scale with length and width. We made it a little bigger than default so that you can manipulate it more easily on a touchscreen. The slider part of the Scale (the part you click and drag) can by sized with sliderlength. Once again, we make the slider larger so that it's easier to work with on a touchscreen.
By default, the numerical value of the Scale is shown next to the slider. We want to turn that off to provide a cleaner interface. The user only needs to drag the slider to a relative position; the exact number does not quite translate to perceived brightness anyway.
Additionally, by setting command=dim, we tell Tkinter that we want to call the dim() function every time the slider is moved. This allows us to set up a callback where we can adjust the PWM value of the LED each time the user interacts with the Scale.
Finally, notice that the dim(i) function now takes a parameter, i. Unlike our button functions in previous examples (which do not take any parameters), the Scale widget requires its callback (as set by command=dim) to accept one parameter. This parameter is the value of the slider; each time the slider is moved, dim(i) is called and i is set to the value of the slider (0-100 in this case).
Blinking LEDs is fun, but what about responding to some kind of user input (I don't mean on the screen)? Responding to physical button pushes can be important if you don't want your user to have to use a touchscreen or mouse and keyboard. In a new file, enter the following code:
language:python
import tkinter as tk

import RPi.GPIO as GPIO

# Declare global variables
root = None
canvas = None
circle = None

# Pins definitions
btn_pin = 4

# Parameters
canvas_width = 100
canvas_height = 100
radius = 30

# Check on button state and update circle color
def poll():

    global root
    global btn_pin
    global canvas
    global circle

    # Make circle red if button is pressed and black otherwise
    if GPIO.input(btn_pin):
        canvas.itemconfig(circle, fill='black')
    else:
        canvas.itemconfig(circle, fill='red')

    # Schedule the poll() function for another 10 ms from now
    root.after(10, poll)

# Set up pins
GPIO.setmode(GPIO.BCM)
GPIO.setup(btn_pin, GPIO.IN)

# Create the main window
root = tk.Tk()
root.title("Button Responder")

# Create the main container
frame = tk.Frame(root)

# Lay out the main container (center it in the window)
frame.place(relx=0.5, rely=0.5, anchor=tk.CENTER)

# Create a canvas widget
canvas = tk.Canvas(frame, width=canvas_width, height=canvas_height)

# Lay out widget in frame
canvas.pack()

# Calculate top left and bottom right coordinates of the circle
x0 = (canvas_width / 2) - radius
y0 = (canvas_height / 2) - radius
x1 = (canvas_width / 2) + radius
y1 = (canvas_height / 2) + radius

# Draw circle on canvas
circle = canvas.create_oval(x0, y0, x1, y1, width=4, fill='black')

# Schedule the poll() function to be called periodically
root.after(10, poll)

# Run forever
root.mainloop()
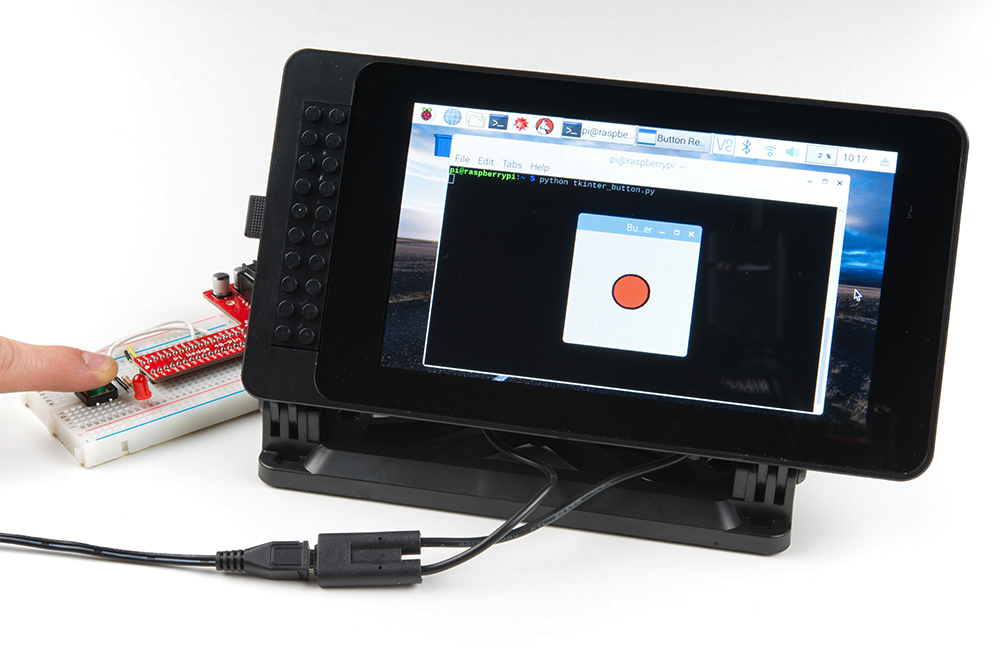
Save it (with a name like tkinter_button.py), and run it. You should see a black circle appear in the middle of your window. When you press the button on the breadboard, the circle should turn red. Neat.
Code to Note:
The most important part of this example is how to poll for a physical button press (or any other hardware interaction on the Pi's GPIO pins). You might have noticed that root.mainloop() is blocking. That is, it takes over your program, and your Python script essentially stops running while it sits in the mainloop method. In reality, there is a lot going on in the background: Tkinter is looking for and responding to events, resizing widgets as necessary, and drawing things to your screen. But for our purposes, it looks like the script just sits there while the GUI is displayed (if the user closes the main GUI window, root.mainloop() will exit).
Since we have a blocking method call, how do we check for a button push? That's where the .after() method comes into play. We set up the poll() function to be called every 10 ms without being in any sort of loop. Since we've moved into the realm of event-driven programming, we must do everything with callbacks!
language:python
root.after(10, poll)
This line says that after 10 ms, the poll() function should be called. The bulk of the poll() function is fairly straightforward: we see if the button has been pressed (the button's GPIO pin is low), and we change the color of the circle in the canvas if it is. However, the end of the function is very important:
language:python
root.after(10, poll)
That's right, at the very end of the poll() function, we tell our main window that it should call the poll() function again! This makes it so that we are checking the state of the button many times every second. We will use this concept of polling for hardware information (separately from the GUI mainloop()) in the next experiment.
We created a circle on the screen by drawing on the canvas with:
language:python
circle = canvas.create_oval(x0, y0, x1, y1, width=4, fill='black')
If you want to learn more about Tkinter's drawing methods, check out this guide on python-course.eu. Additionally, effbot.org has a good reference for all the different drawing methods.
In this next experiment, we're going to connect a couple of I2C sensors and display their information in real time on our monitor. We start by just showing the sensor's numerical values and then bring in Matplotlib to create a live updating graph of that data. Note that these are just example sensors; feel free to use whatever sensors you'd like for your particular application.
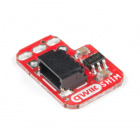
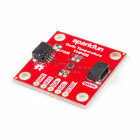
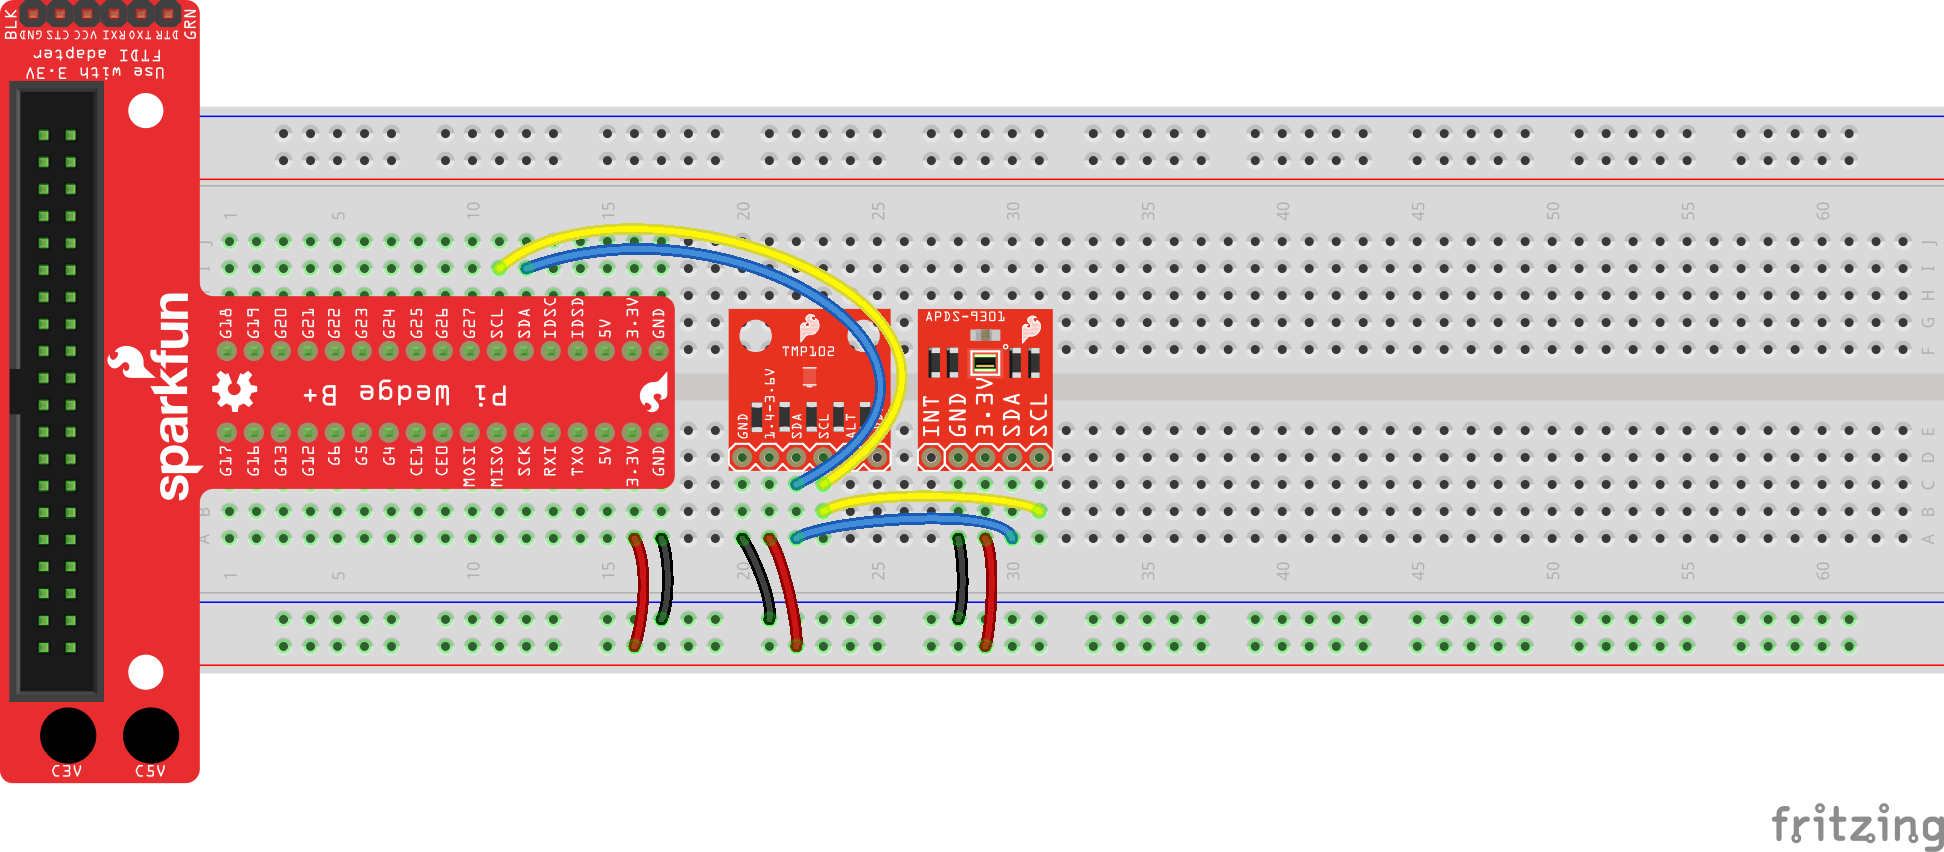
Connect a TMP102 Temperature Sensor breakout and APDS-9301 Ambient Light Sensor breakout to the Raspberry Pi as shown in the diagrams below.
Connecting through a Pi Wedge:
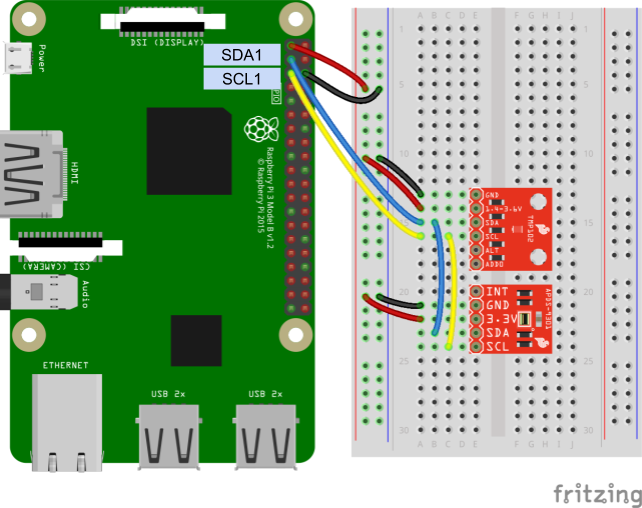
Connecting directly to the Raspberry Pi:
To simplify our I2C reading and writing, we're going to copy in Python modules to read data from the TMP102 and APDS-9301 sensors. Open a new file named tmp102.py:
language:bash
nano tmp102.py
Copy in the following Python code:
language:python
import smbus

# Module variables
i2c_ch = 1
bus = None

# TMP102 address on the I2C bus
i2c_address = 0x48

# Register addresses
reg_temp = 0x00
reg_config = 0x01

# Calculate the 2's complement of a number
def twos_comp(val, bits):
    if (val & (1 << (bits - 1))) != 0:
        val = val - (1 << bits)
    return val

# Read temperature registers and calculate Celsius
def read_temp():

    global bus

    # Read temperature registers
    val = bus.read_i2c_block_data(i2c_address, reg_temp, 2)
    temp_c = (val[0] << 4) | (val[1] >> 4)

    # Convert to 2s complement (temperatures can be negative)
    temp_c = twos_comp(temp_c, 12)

    # Convert registers value to temperature (C)
    temp_c = temp_c * 0.0625

    return temp_c

# Initialize communications with the TMP102
def init():

    global bus

    # Initialize I2C (SMBus)
    bus = smbus.SMBus(i2c_ch)

    # Read the CONFIG register (2 bytes)
    val = bus.read_i2c_block_data(i2c_address, reg_config, 2)

    # Set to 4 Hz sampling (CR1, CR0 = 0b10)
    val[1] = val[1] & 0b00111111
    val[1] = val[1] | (0b10 << 6)

    # Write 4 Hz sampling back to CONFIG
    bus.write_i2c_block_data(i2c_address, reg_config, val)

    # Read CONFIG to verify that we changed it
    val = bus.read_i2c_block_data(i2c_address, reg_config, 2)
Save the code with ctrl + x, press y, and press enter. This module allows us to call init() and read_temp() functions to initialize and read temperature data from the TMP102.
Similarly, we need to create a module for our APDS-9301. Create a new file named apds9301.py:
language:bash
nano apds9301.py
Copy in the following code:
language:python
import smbus

# Module variables
i2c_ch = 1
bus = None

# APDS-9301 address on the I2C bus
apds9301_addr = 0x39

# Register addresses
apds9301_control_reg = 0x80
apds9301_timing_reg = 0x81
apds9301_data0low_reg = 0x8C
apds9301_data1low_reg = 0x8E

# Initialize communications and turn on the APDS-9301
def init():

    global bus

    # Initialize I2C (SMBus)
    bus = smbus.SMBus(i2c_ch)

    # Read the CONTROL register (1 byte)
    val = bus.read_i2c_block_data(apds9301_addr, apds9301_control_reg, 1)

    # Set POWER to on in the CONTROL register
    val[0] = val[0] & 0b11111100
    val[0] = val[0] | 0b11

    # Enable the APDS-9301 by writing back to CONTROL register
    bus.write_i2c_block_data(apds9301_addr, apds9301_control_reg, val)

# Read light data from sensor and calculate lux
def read_lux():

    global bus

    # Read channel 0 light value and combine 2 bytes into 1 number
    val = bus.read_i2c_block_data(apds9301_addr, apds9301_data0low_reg, 2)
    ch0 = (val[1] << 8) | val[0]

    # Read channel 1 light value and combine 2 bytes into 1 number
    val = bus.read_i2c_block_data(apds9301_addr, apds9301_data1low_reg, 2)
    ch1 = (val[1] << 8) | val[0]

    # Make sure we don't divide by 0
    if ch0 == 0.0:
        return 0.0

    # Calculate ratio of ch1 and ch0
    ratio = ch1 / ch0

    # Assume we are using the default 13.7 ms integration time on the sensor
    # So, scale raw light values by 1/0.034 as per the datasheet
    ch0 *= 1 / 0.034
    ch1 *= 1 / 0.034

    # Assume we are using the default low gain setting
    # So, scale raw light values by 16 as per the datasheet
    ch0 *= 16;
    ch1 *= 16;

    # Calculate lux based on the ratio as per the datasheet
    if ratio <= 0.5:
        return (0.0304 * ch0) - ((0.062 * ch0) * ((ch1/ch0) ** 1.4))
    elif ratio <= 0.61:
        return (0.0224 * ch0) - (0.031 * ch1)
    elif ratio <= 0.8:
        return (0.0128 * ch0) - (0.0153 * ch1)
    elif ratio <= 1.3:
        return (0.00146 * ch0) - (0.00112*ch1)
    else:
        return 0.0
Save and exit with ctrl + x, y, and enter. Like our tmp102 module, we can call init() and read_lux() to initialize and read the ambient light values from the APDS-9301 sensor.
Let's start by making a simple display that takes up the full screen and shows the numerical temperature and ambient light values. Copy the following code into a new file:
language:python
import tkinter as tk
import tkinter.font as tkFont

import tmp102
import apds9301

###############################################################################
# Parameters and global variables

# Declare global variables
root = None
dfont = None
frame = None
temp_c = None
lux = None

# Global variable to remember if we are fullscreen or windowed
fullscreen = False

###############################################################################
# Functions

# Toggle fullscreen
def toggle_fullscreen(event=None):

    global root
    global fullscreen

    # Toggle between fullscreen and windowed modes
    fullscreen = not fullscreen
    root.attributes('-fullscreen', fullscreen)
    resize()

# Return to windowed mode
def end_fullscreen(event=None):

    global root
    global fullscreen

    # Turn off fullscreen mode
    fullscreen = False
    root.attributes('-fullscreen', False)
    resize()

# Automatically resize font size based on window size
def resize(event=None):

    global dfont
    global frame

    # Resize font based on frame height (minimum size of 12)
    # Use negative number for "pixels" instead of "points"
    new_size = -max(12, int((frame.winfo_height() / 10)))
    dfont.configure(size=new_size)

# Read values from the sensors at regular intervals
def poll():

    global root
    global temp_c
    global lux

    # Update labels to display temperature and light values
    try:
        val = round(tmp102.read_temp(), 2)
        temp_c.set(val)
        val = round(apds9301.read_lux(), 1)
        lux.set(val)
    except:
        pass

    # Schedule the poll() function for another 500 ms from now
    root.after(500, poll)

###############################################################################
# Main script

# Create the main window
root = tk.Tk()
root.title("The Big Screen")

# Create the main container
frame = tk.Frame(root)

# Lay out the main container (expand to fit window)
frame.pack(fill=tk.BOTH, expand=1)

# Variables for holding temperature and light data
temp_c = tk.DoubleVar()
lux = tk.DoubleVar()

# Create dynamic font for text
dfont = tkFont.Font(size=-24)

# Create widgets
label_temp = tk.Label(frame, text="Temperature:", font=dfont)
label_celsius = tk.Label(frame, textvariable=temp_c, font=dfont)
label_unitc = tk.Label(frame, text="°C", font=dfont)
label_light = tk.Label(frame, text="Light:", font=dfont)
label_lux = tk.Label(frame, textvariable=lux, font=dfont)
label_unitlux = tk.Label(frame, text="lux", font=dfont)
button_quit = tk.Button(frame, text="Quit", font=dfont, command=root.destroy)

# Lay out widgets in a grid in the frame
label_temp.grid(row=0, column=0, padx=5, pady=5, sticky=tk.E)
label_celsius.grid(row=0, column=1, padx=5, pady=5, sticky=tk.E)
label_unitc.grid(row=0, column=2, padx=5, pady=5, sticky=tk.W)
label_light.grid(row=1, column=0, padx=5, pady=5, sticky=tk.E)
label_lux.grid(row=1, column=1, padx=5, pady=5, sticky=tk.E)
label_unitlux.grid(row=1, column=2, padx=5, pady=5, sticky=tk.W)
button_quit.grid(row=2, column=2, padx=5, pady=5)

# Make it so that the grid cells expand out to fill window
for i in range(0, 3):
    frame.rowconfigure(i, weight=1)
for i in range(0, 3):
    frame.columnconfigure(i, weight=1)

# Bind F11 to toggle fullscreen and ESC to end fullscreen
root.bind('<F11>', toggle_fullscreen)
root.bind('<Escape>', end_fullscreen)

# Have the resize() function be called every time the window is resized
root.bind('<Configure>', resize)

# Initialize our sensors
tmp102.init()
apds9301.init()

# Schedule the poll() function to be called periodically
root.after(500, poll)

# Start in fullscreen mode and run
toggle_fullscreen()
root.mainloop()
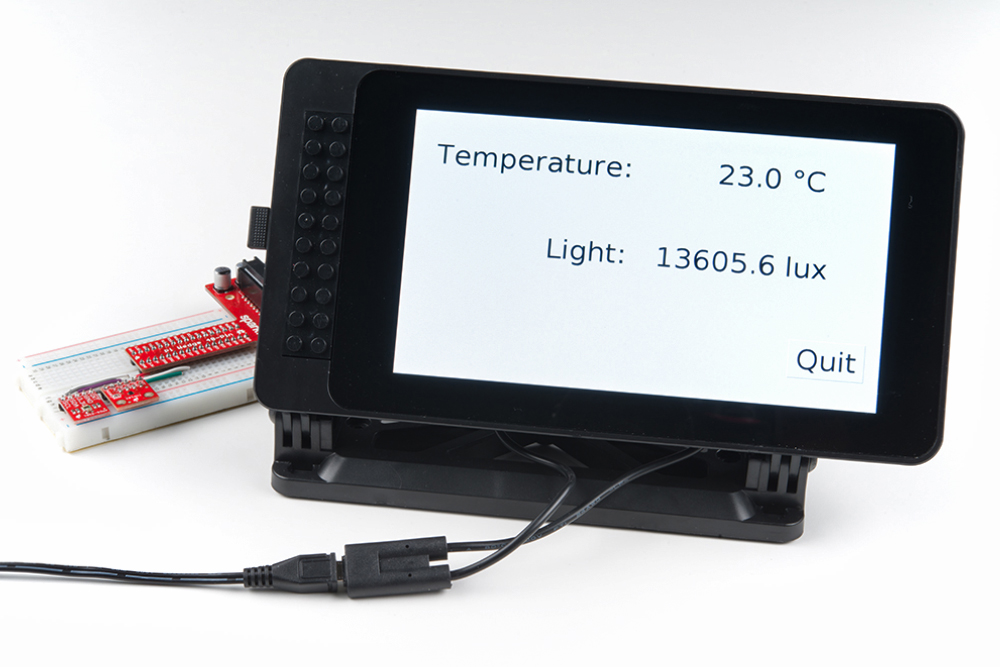
Save the file with a name like tkinter_fullscreen.py and run it. Your entire screen should be taken over by the GUI, and you should see the local ambient temperature and light values displayed. Try covering the light sensor or breathing on the temperature sensor to change their values. Press esc to exit fullscreen or press F11 to toggle fullscreen on and off.
Code to Note:
To control having our application take up the entire screen, we use the following method:
language:python
root.attributes('-fullscreen', fullscreen)
where the fullscreen variable is a boolean (True or False). If you look toward the end of the code, you'll see the following two lines:
language:python
root.bind('<F11>', toggle_fullscreen)
root.bind('<Escape>', end_fullscreen)
These bind the key presses F11 and esc to the toggle_fullscreen() and end_fullscreen() functions, respectively. These allow the user to control if the application takes up the entire screen or is in a window.
We also use the rowconfigure() and columnconfigure() methods again to control how the grid cells resize within the window. We combine this with a dynamic font:
language:python
dfont = tkFont.Font(size=-24)
Note that the negative number (-24) means we want to specify the font size in pixels instead of "points." We also have our resize() function called every time the window is resized with the following:
language:python
root.bind('<Configure>', resize)
In our resize() function, we calculate a new font size based on the height of the resized frame with:
language:python
new_size = -max(12, int((frame.winfo_height() / 10)))
This says that the new font size should be the height of the frame divided by 10, but no smaller than 12. We turn it into a negative value, as we want to specify font height in pixels instead of points (once again). We then set the new font size with:
language:python
dfont.configure(size=new_size)
Try it! With the application running, press esc to exit fullscreen mode and try resizing the window. You should see the text grow and shrink as necessary. It's not perfect, as certain aspect ratios will cut off portions of the text, but it should work without a problem in fullscreen mode (the intended application).
If you are using a touchscreen, you might not have an easy way for users to resize the window or quit out of the application (in some instances, that might be a good thing, but for our example, we want users to be able to exit). To accomplish this, we add a "Quit" button to our GUI:
language:python
button_quit = tk.Button(frame, text="Quit", font=dfont, command=root.destroy)
We assign the callback function to be root.destroy. This is a built-in method within Tkinter that says to close the associated window and exit out of mainloop.
You'll also notice that we are relying on the after() method again to call our poll() function at regular intervals.
Now it's time to get fancy. Let's take the basic dashboard concept and add plotting. To do this, we'll need to pull in the Matplotlib package. If you have not already installed it, run the following commands in a terminal:
language:bash
sudo apt-get update
sudo apt-get install libatlas3-base libffi-dev at-spi2-core python3-gi-cairo
pip install cairocffi
pip install matplotlib
In a new file, copy in the following code:
language:python
import datetime as dt
import tkinter as tk
import tkinter.font as tkFont

import matplotlib.figure as figure
import matplotlib.animation as animation
import matplotlib.dates as mdates
from matplotlib.backends.backend_tkagg import FigureCanvasTkAgg
import tmp102
import apds9301

###############################################################################
# Parameters and global variables

# Parameters
update_interval = 60000 # Time (ms) between polling/animation updates
max_elements = 1440     # Maximum number of elements to store in plot lists

# Declare global variables
root = None
dfont = None
frame = None
canvas = None
ax1 = None
temp_plot_visible = None


# Global variable to remember various states
fullscreen = False
temp_plot_visible = True
light_plot_visible = True

###############################################################################
# Functions

# Toggle fullscreen
def toggle_fullscreen(event=None):

    global root
    global fullscreen

    # Toggle between fullscreen and windowed modes
    fullscreen = not fullscreen
    root.attributes('-fullscreen', fullscreen)
    resize(None)

# Return to windowed mode
def end_fullscreen(event=None):

    global root
    global fullscreen

    # Turn off fullscreen mode
    fullscreen = False
    root.attributes('-fullscreen', False)
    resize(None)

# Automatically resize font size based on window size
def resize(event=None):

    global dfont
    global frame

    # Resize font based on frame height (minimum size of 12)
    # Use negative number for "pixels" instead of "points"
    new_size = -max(12, int((frame.winfo_height() / 15)))
    dfont.configure(size=new_size)

# Toggle the temperature plot
def toggle_temp():

    global canvas
    global ax1
    global temp_plot_visible

    # Toggle plot and axis ticks/label
    temp_plot_visible = not temp_plot_visible
    ax1.collections[0].set_visible(temp_plot_visible)
    ax1.get_yaxis().set_visible(temp_plot_visible)
    canvas.draw()

# Toggle the light plot
def toggle_light():

    global canvas
    global ax2
    global light_plot_visible

    # Toggle plot and axis ticks/label
    light_plot_visible = not light_plot_visible
    ax2.get_lines()[0].set_visible(light_plot_visible)
    ax2.get_yaxis().set_visible(light_plot_visible)
    canvas.draw()

# This function is called periodically from FuncAnimation
def animate(i, ax1, ax2, xs, temps, lights, temp_c, lux):

    # Update data to display temperature and light values
    try:
        new_temp = round(tmp102.read_temp(), 2)
        new_lux = round(apds9301.read_lux(), 1)
    except:
        pass

    # Update our labels
    temp_c.set(new_temp)
    lux.set(new_lux)

    # Append timestamp to x-axis list
    timestamp = mdates.date2num(dt.datetime.now())
    xs.append(timestamp)

    # Append sensor data to lists for plotting
    temps.append(new_temp)
    lights.append(new_lux)

    # Limit lists to a set number of elements
    xs = xs[-max_elements:]
    temps = temps[-max_elements:]
    lights = lights[-max_elements:]

    # Clear, format, and plot light values first (behind)
    color = 'tab:red'
    ax1.clear()
    ax1.set_ylabel('Temperature (C)', color=color)
    ax1.tick_params(axis='y', labelcolor=color)
    ax1.fill_between(xs, temps, 0, linewidth=2, color=color, alpha=0.3)

    # Clear, format, and plot temperature values (in front)
    color = 'tab:blue'
    ax2.clear()
    ax2.set_ylabel('Light (lux)', color=color)
    ax2.tick_params(axis='y', labelcolor=color)
    ax2.plot(xs, lights, linewidth=2, color=color)

    # Format timestamps to be more readable
    ax1.xaxis.set_major_formatter(mdates.DateFormatter('%H:%M'))
    fig.autofmt_xdate()

    # Make sure plots stay visible or invisible as desired
    ax1.collections[0].set_visible(temp_plot_visible)
    ax2.get_lines()[0].set_visible(light_plot_visible)

# Dummy function prevents segfault
def _destroy(event):
    pass

###############################################################################
# Main script

# Create the main window
root = tk.Tk()
root.title("Sensor Dashboard")

# Create the main container
frame = tk.Frame(root)
frame.configure(bg='white')

# Lay out the main container (expand to fit window)
frame.pack(fill=tk.BOTH, expand=1)

# Create figure for plotting
fig = figure.Figure(figsize=(2, 2))
fig.subplots_adjust(left=0.1, right=0.8)
ax1 = fig.add_subplot(1, 1, 1)

# Instantiate a new set of axes that shares the same x-axis
ax2 = ax1.twinx()

# Empty x and y lists for storing data to plot later
xs = []
temps = []
lights = []

# Variables for holding temperature and light data
temp_c = tk.DoubleVar()
lux = tk.DoubleVar()

# Create dynamic font for text
dfont = tkFont.Font(size=-24)

# Create a Tk Canvas widget out of our figure
canvas = FigureCanvasTkAgg(fig, master=frame)
canvas_plot = canvas.get_tk_widget()

# Create other supporting widgets
label_temp = tk.Label(frame, text='Temperature:', font=dfont, bg='white')
label_celsius = tk.Label(frame, textvariable=temp_c, font=dfont, bg='white')
label_unitc = tk.Label(frame, text="C", font=dfont, bg='white')
label_light = tk.Label(frame, text="Light:", font=dfont, bg='white')
label_lux = tk.Label(frame, textvariable=lux, font=dfont, bg='white')
label_unitlux = tk.Label(frame, text="lux", font=dfont, bg='white')
button_temp = tk.Button(    frame,
                            text="Toggle Temperature",
                            font=dfont,
                            command=toggle_temp)
button_light = tk.Button(   frame,
                            text="Toggle Light",
                            font=dfont,
                            command=toggle_light)
button_quit = tk.Button(    frame,
                            text="Quit",
                            font=dfont,
                            command=root.destroy)

# Lay out widgets in a grid in the frame
canvas_plot.grid(   row=0,
                    column=0,
                    rowspan=5,
                    columnspan=4,
                    sticky=tk.W+tk.E+tk.N+tk.S)
label_temp.grid(row=0, column=4, columnspan=2)
label_celsius.grid(row=1, column=4, sticky=tk.E)
label_unitc.grid(row=1, column=5, sticky=tk.W)
label_light.grid(row=2, column=4, columnspan=2)
label_lux.grid(row=3, column=4, sticky=tk.E)
label_unitlux.grid(row=3, column=5, sticky=tk.W)
button_temp.grid(row=5, column=0, columnspan=2)
button_light.grid(row=5, column=2, columnspan=2)
button_quit.grid(row=5, column=4, columnspan=2)

# Add a standard 5 pixel padding to all widgets
for w in frame.winfo_children():
    w.grid(padx=5, pady=5)

# Make it so that the grid cells expand out to fill window
for i in range(0, 5):
    frame.rowconfigure(i, weight=1)
for i in range(0, 5):
    frame.columnconfigure(i, weight=1)

# Bind F11 to toggle fullscreen and ESC to end fullscreen
root.bind('<F11>', toggle_fullscreen)
root.bind('<Escape>', end_fullscreen)

# Have the resize() function be called every time the window is resized
root.bind('<Configure>', resize)

# Call empty _destroy function on exit to prevent segmentation fault
root.bind("<Destroy>", _destroy)

# Initialize our sensors
tmp102.init()
apds9301.init()

# Call animate() function periodically
fargs = (ax1, ax2, xs, temps, lights, temp_c, lux)
ani = animation.FuncAnimation(  fig,
                                animate,
                                fargs=fargs,
                                interval=update_interval)

# Start in fullscreen mode and run
toggle_fullscreen()
root.mainloop()
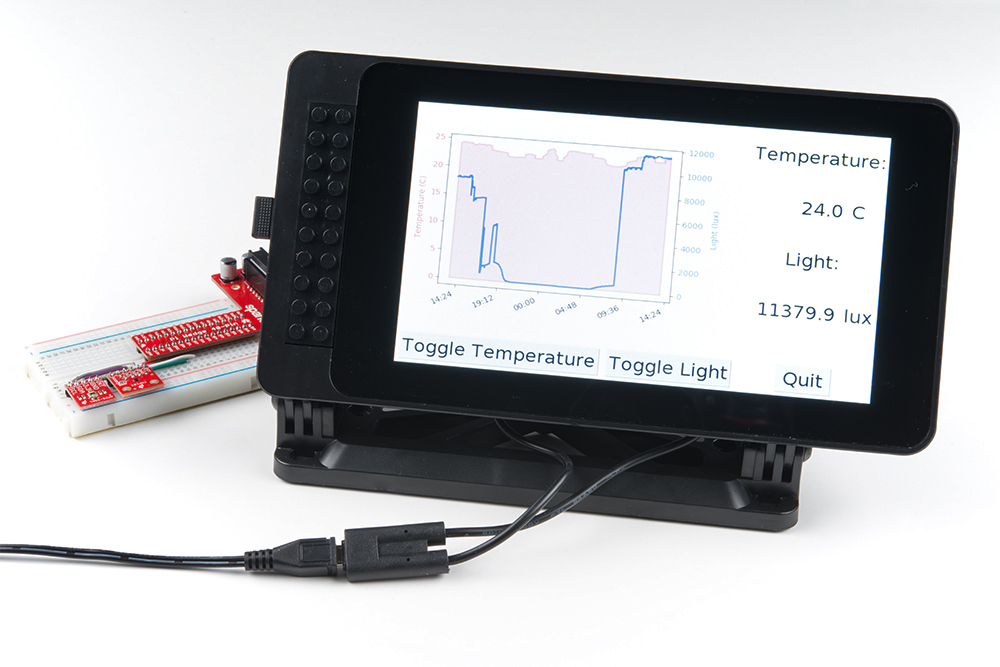
Save the program (with a fun name like tkinter_dashboard.py), and run it. You should see your sensor data displayed as numerical values as well as a plot that updates once per minute.
Try pushing the "Toggle Temperature" and "Toggle Light" buttons. You should see the graph of each one disappear and reappear with each button press. This demonstrates how you can make an interactive plot using both Tkinter and Matplotlib.
You can update the update_interval variable to have the sensors polled more quickly, but it can also be fun to poll once per minute (default) and let it run for a day, as I did in my office:
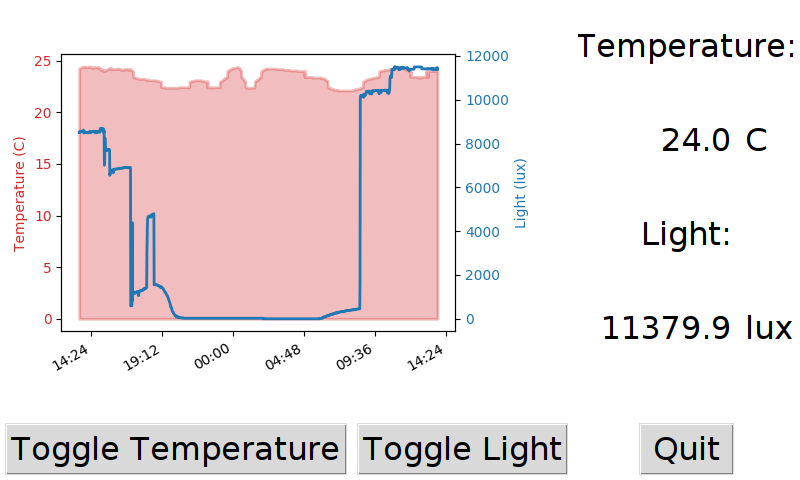
If you look closely at the graph, you can see that the temperatures fell a little after 7pm, rose again, and then fell once more just before the workday started at 9am the following morning. We can surmise that the building air conditioning was running at those times to make it cooler.
Additionally, you can see that someone came into the office in the 6-7pm timeframe, as the ambient light value picked up for a short amount. Considering I did not move the sensors the next day, it looks like either more lights were on, or it was a sunnier day outside, as more light was falling on the sensor.
Code to Note:
There is a lot going on in this example, so we'll try to cover it as succinctly as possible. Many of the concepts from the previous example, like binding key presses to trigger toggling fullscreen, are still present. Animating a graph is covered in the previous Python tutorial that introduced Matplotlib (specifically, the section about updating a graph in real time). If you are not familiar with Matplotlib, we recommend working through the following tutorial:
The key to embedding a Matplotlib graph into a Tkinter GUI is to work with Matplotlib's backend, which is why we import the following:
language:python
from matplotlib.backends.backend_tkagg import FigureCanvasTkAgg
With that, we first create our Matplotlib figure and a set of axes to draw our plot on:
language:python
# Create figure for plotting
fig = figure.Figure(figsize=(2, 2))
fig.subplots_adjust(left=0.1, right=0.8)
ax1 = fig.add_subplot(1, 1, 1)
A few lines later, we create a Tkinter widget out of that figure:
language:python
# Create a Tk Canvas widget out of our figure
canvas = FigureCanvasTkAgg(fig, master=frame)
canvas_plot = canvas.get_tk_widget()
These lines use our imported FigureCanvasTkAgg function to take a figure and turn it into a Tkinter Canvas. We get a handle to this canvas and lay it out in our grid just like any other widget:
language:python
canvas_plot.grid(   row=0,
                    column=0,
                    rowspan=5,
                    columnspan=4,
                    sticky=tk.W+tk.E+tk.N+tk.S)
Instead of the periodic poll() callback that we used in the previous examples, we set up a FuncAnimation() to handle the polling and updating of the graph:
language:python
# Call animate() function periodically
fargs = (ax1, ax2, xs, temps, lights, temp_c, lux)
ani = animation.FuncAnimation(  fig,
                                animate,
                                fargs=fargs,
                                interval=update_interval)
In the animate() function, we read the sensors' data (just like we did in poll()) and append it to the end of some arrays. We use this to redraw the plots on the axes (which are ultimately drawn on the Tkinter canvas widget). Note that we used .fill_between() to create the translucent red graph for temperature and a regular .plot() to create the basic blue line graph for light value.
For another example on importing Matplotlib into Tkinter, see this demo from the official Matplotlib documentation.
Creating a GUI can be a good way to offer an easy-to-use interface for your customer or create a slick-looking dashboard for yourself (and your team). If you would like to learn more about Tkinter, we recommend the following resources:
Try out the various widgets and play with different layouts to get the effect you are looking for.
Looking for even more inspiration? Check out these other Raspberry Pi projects:
learn.sparkfun.com | CC BY-SA 3.0 | SparkFun Electronics | Niwot, Colorado