$25.50
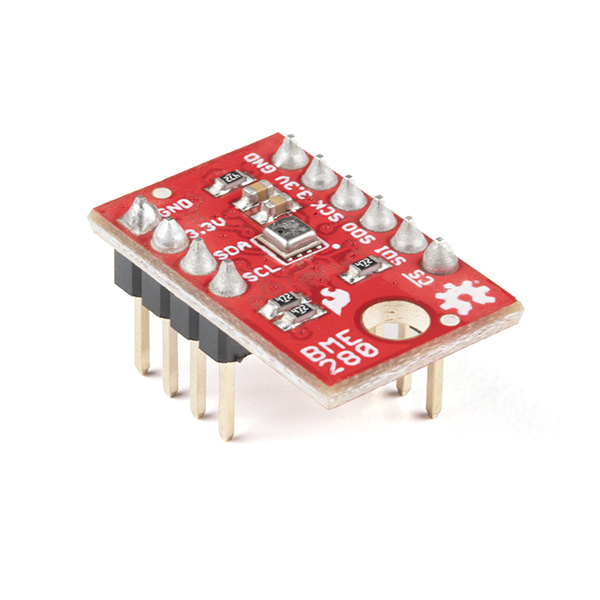
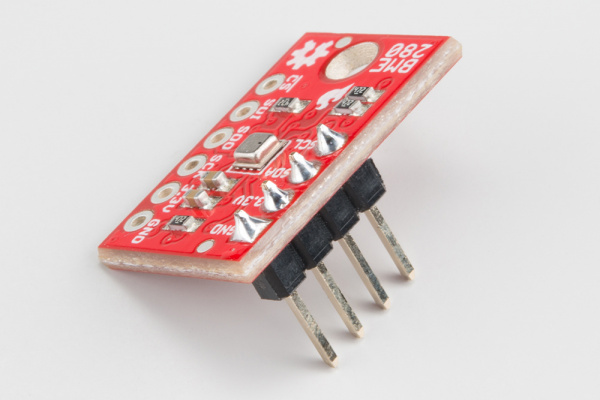
The BME280 Breakout Board is the easy way to measure pressure and humidity, and without taking up a lot of room. It gives you easy to solder 0.1" headers, runs I2C or SPI, takes measurements at less than 1mA and idles less than 5uA (yes, microamps!).
The BME280 can be used to take pressure, humidity, and temperature readings. Use the data to get relative altitude changes, or absolute altitude if the locally reported barometric pressure is known.
Ranges:
This tutorial gives you all you need to get going with the BME280. First we'll take a look at the IC and hardware, then we'll use the SparkFun BME280 Arduino library to get data out of it by SPI or I2C.
The tutorial is split into the following pages:
Get the datasheet and application notes now. Keep a copy to refer to once you get off the charted path.
This tutorial explains how to use the BME280 Breakout Board with an RedBoard (or Arduino). To follow along, you'll need the following materials:
If you use a 3.3V-based micro -- like the Arduino Pro 3.3V or 3.3V Pro Mini -- there is no need for level shifting.
Connection of the BME280 uses some basic concepts shared by a lot of our products. If you want to get more familiar with these basic tasks, these articles can help you out.
If the concepts of pressure are weighing on you, check out these links.
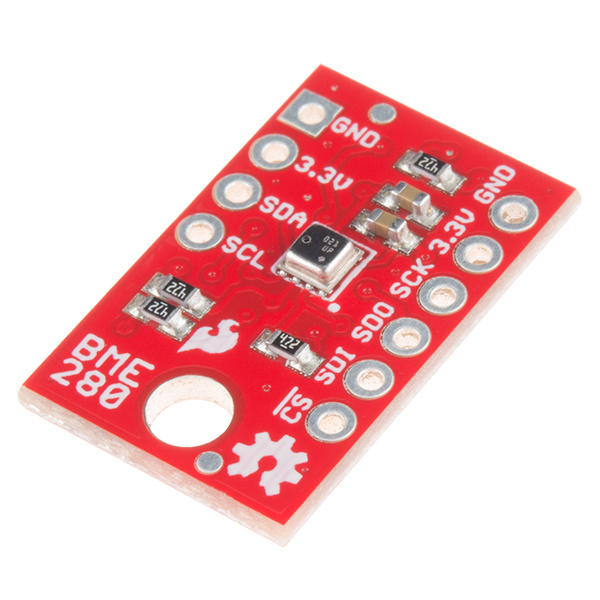
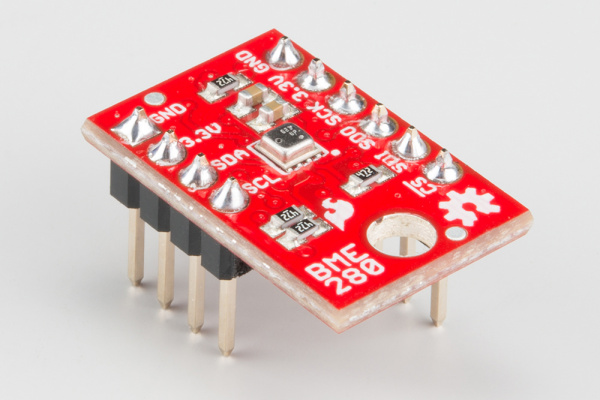
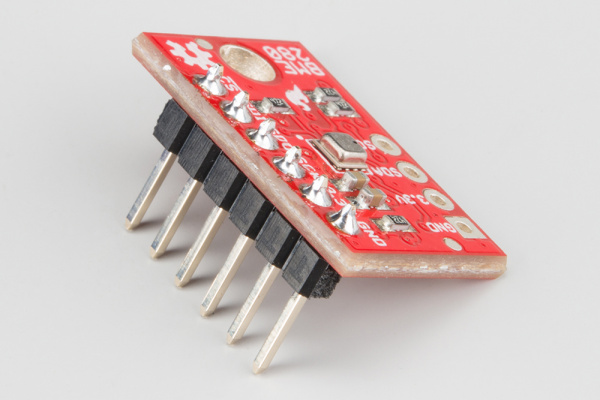
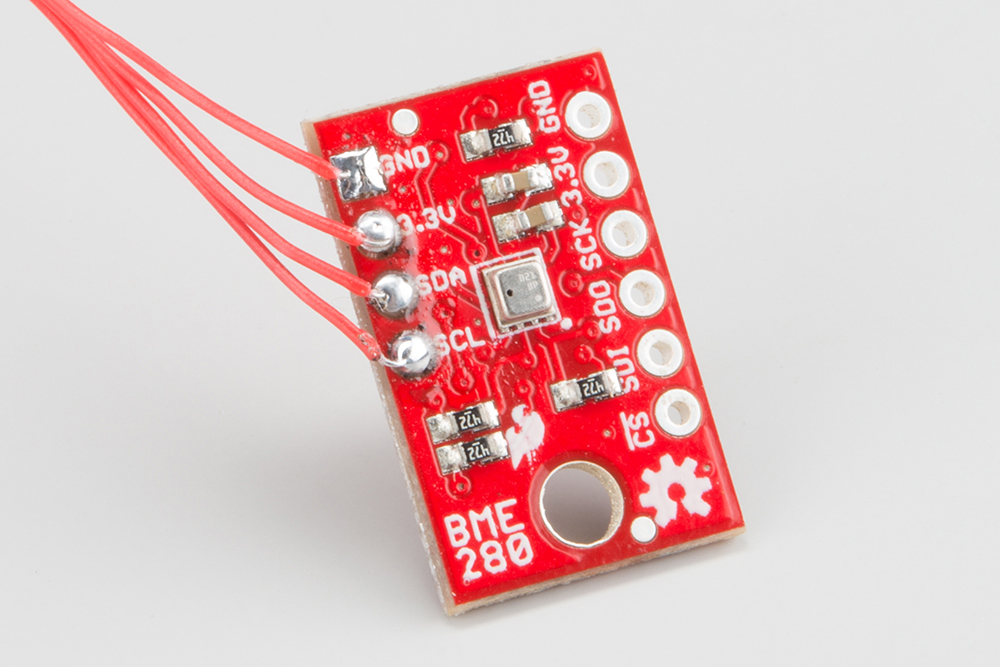
The BME280 Breakout board has 10 pins, but no more than 6 are used at a single time.
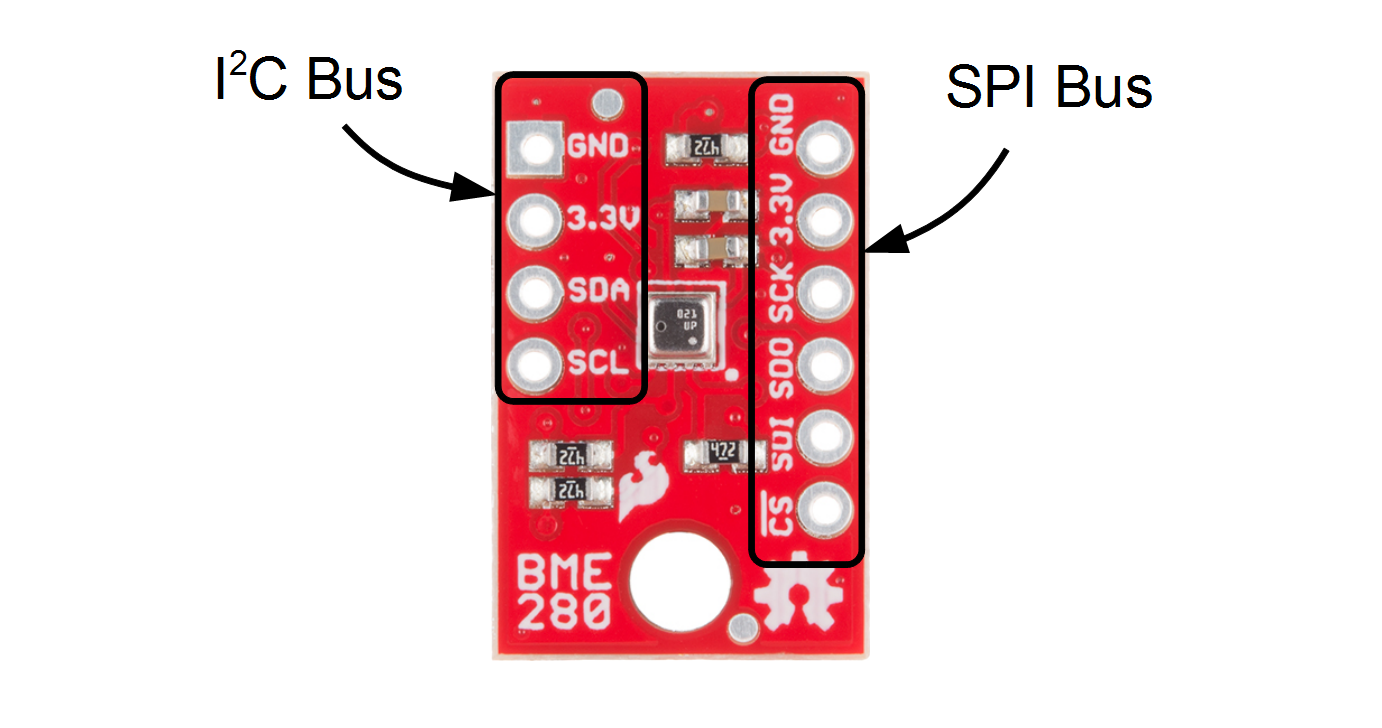
The left side of the board are power, ground, and I2C pins.
| Pin Label | Pin Function | Notes |
|---|---|---|
| GND | Ground | 0V voltage supply. |
| 3.3v | Power Supply | Supply voltage to the chip. Should be regulated between 1.8V and 3.6V. |
| SDA | Data | I2C: Serial data (bi-directional) |
| SCL | Serial Clock | I2C serial clock. |
The remaining pins are broken out on the other side. These pins break out SPI functionality and have another power and ground.
| Pin Label | Pin Function | Notes |
|---|---|---|
| GND | Ground | 0V voltage supply. |
| 3.3v | Power Supply | Supply voltage to the chip. Should be regulated between 1.8V and 3.6V. |
| SCK | Clock | Clock line, 3.6V max |
| SDO | Data out | Data comming out of the BME280 (MISO) |
| SDI | Data in | Data going into the BME280, 3.6V max (MOSI) |
| !CS | Chip Select (Slave Select) | Active low chip select, 3.6V max |
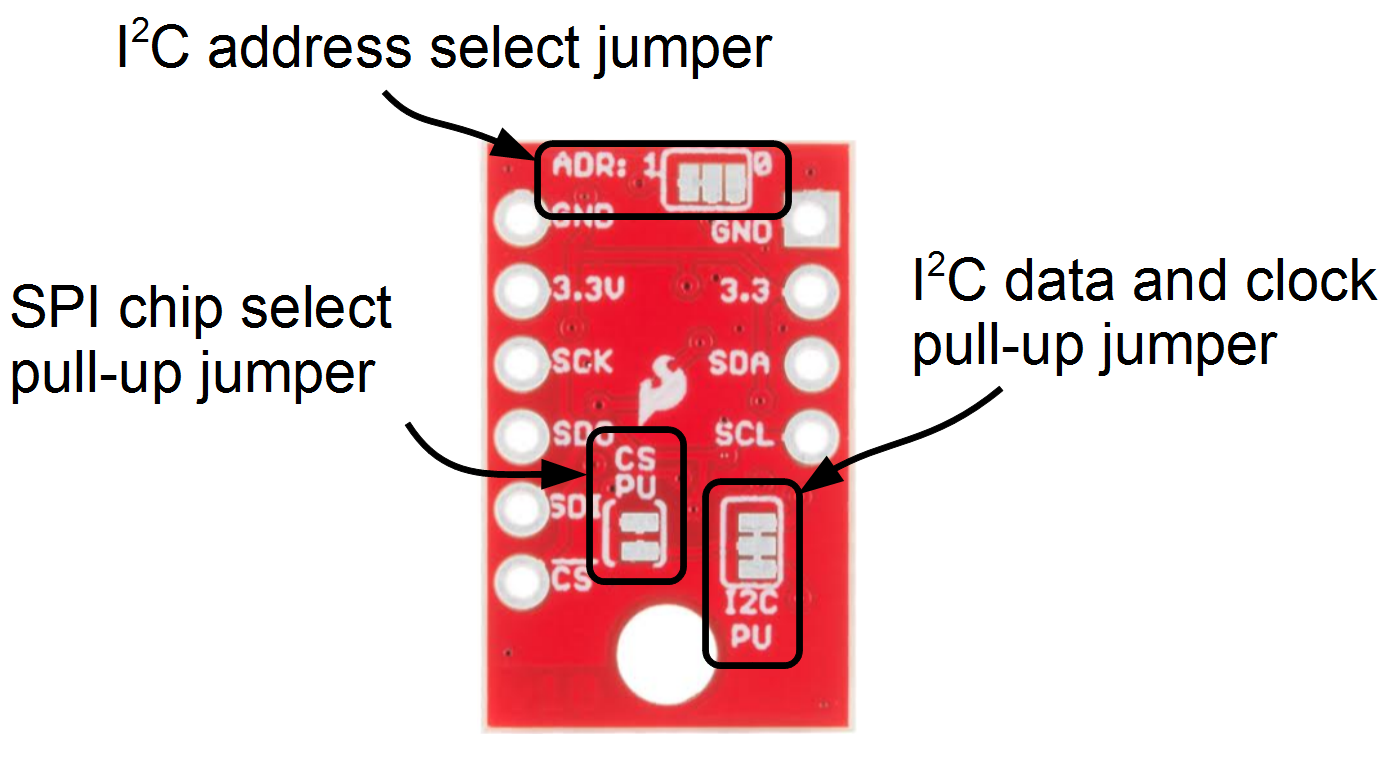
On the other side of the board you'll find all the configuration jumpers. Pull-ups can be left connected even when using SPI mode, so you'll probably never have to touch these. If you do, here's what they're for.
| Jumper Label | Jumper Function | Notes |
|---|---|---|
| ADR: | I2C Address | Select between addresses 0x77 (default, '1' side) and 0x76 by slicing the trace and bridging the '0' side. Controls the least significant bit. |
| CS PU | SPI chip select pull-up | Connects a 4.7k resistor to the CS line to make sure it is idle high. Can be disconnected by slicing between the jumper pads. |
| I2C | I2C pull-ups | Connects the I2C pull-up resistors to 3.3V. Cut the trace to disconnect them if necessary. |
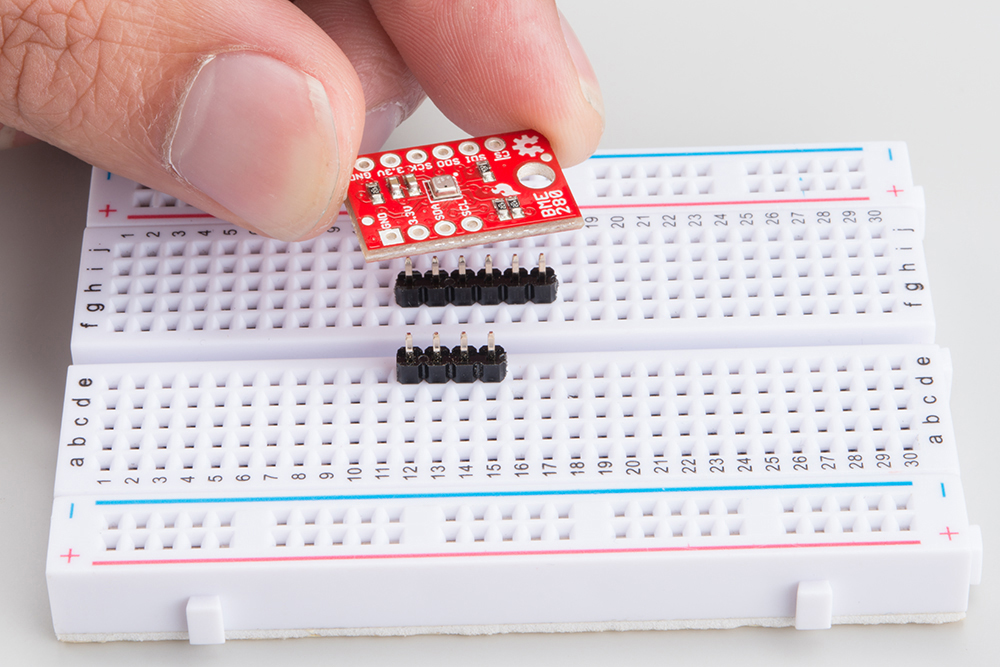
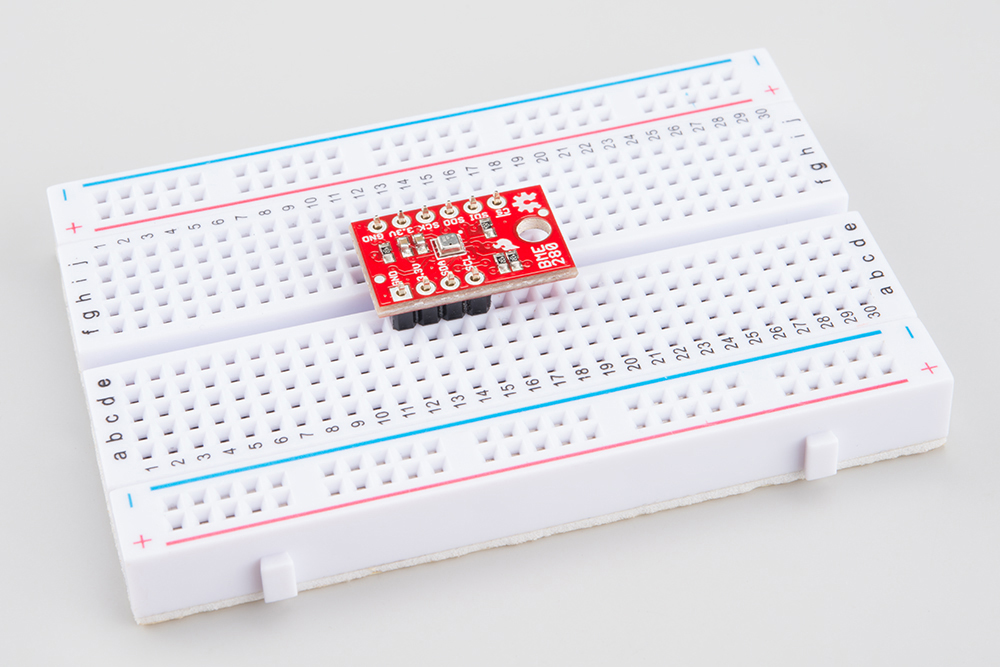
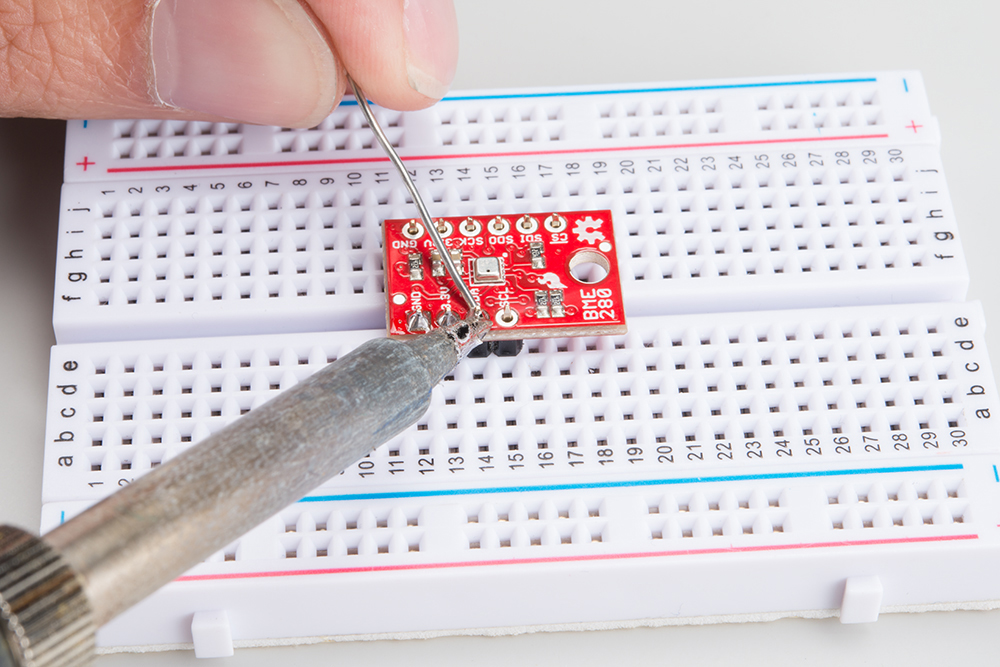
If you got a board without headers, you will need to solder to the PTH pads. Regular wires can be soldered in, but for a more configurable breadboard experience you may want to attach headers.
 |
 |
 |
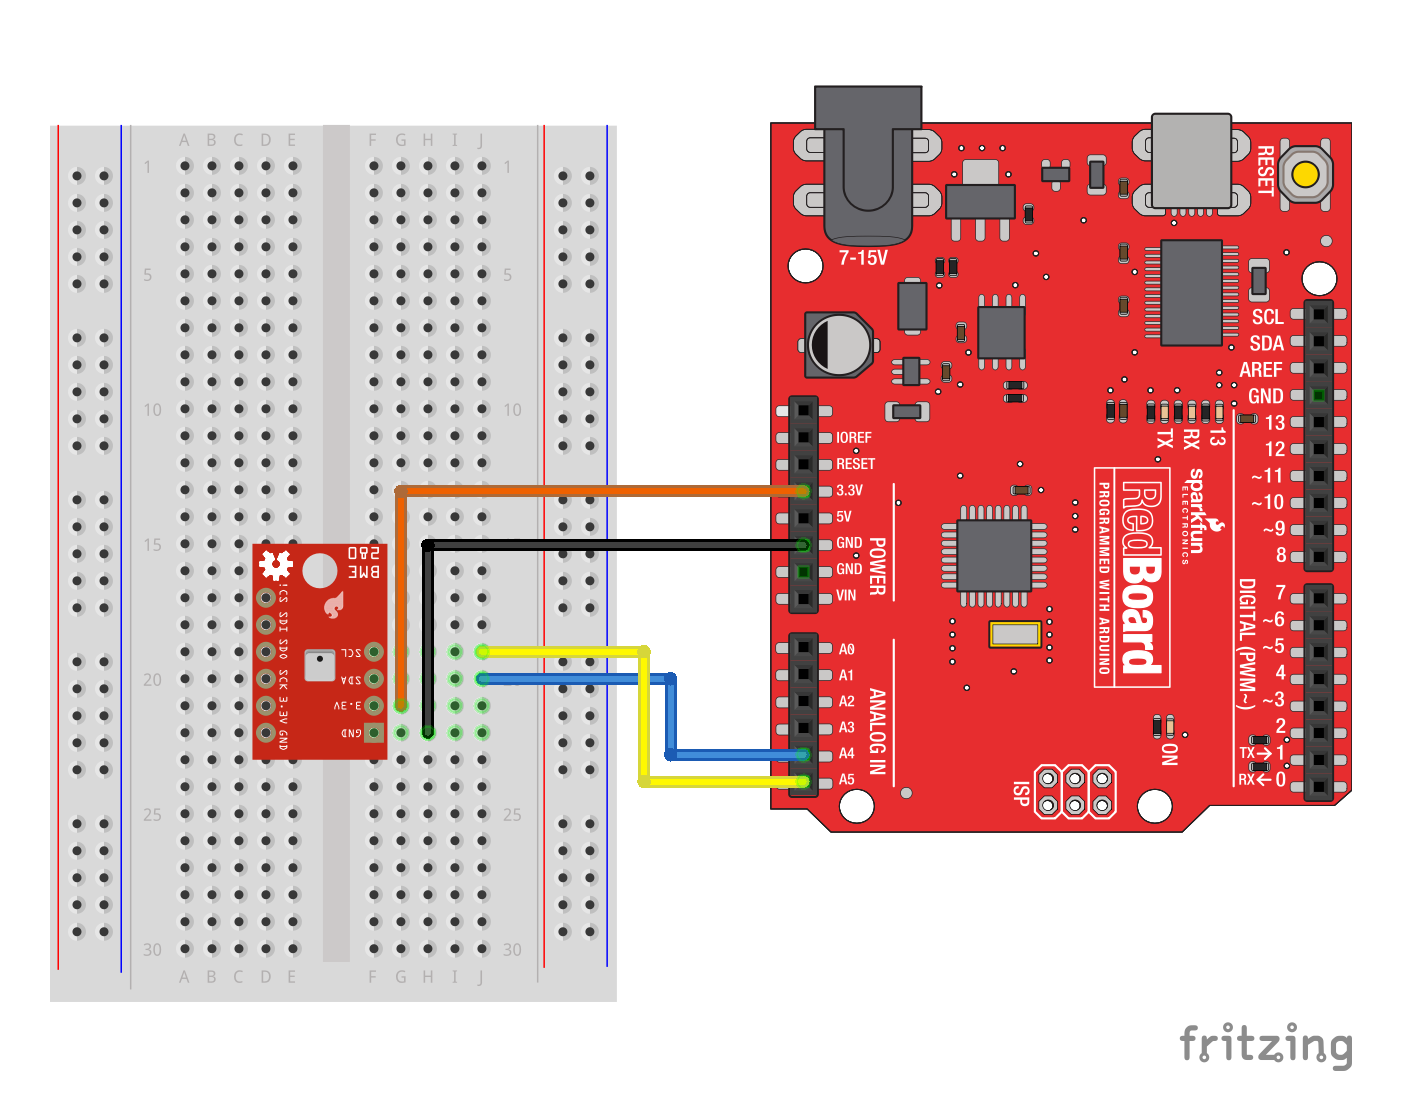
The sensor pulls the I2C lines to 3.3V, so they can be directly connect to the redboard's A4/A5 pins, or the SDA/SCL pins (as long as they're configured by Wire). Make sure to power the sensor from 3.3v! The power and ground pins are connected, so you only need to connect to one side.
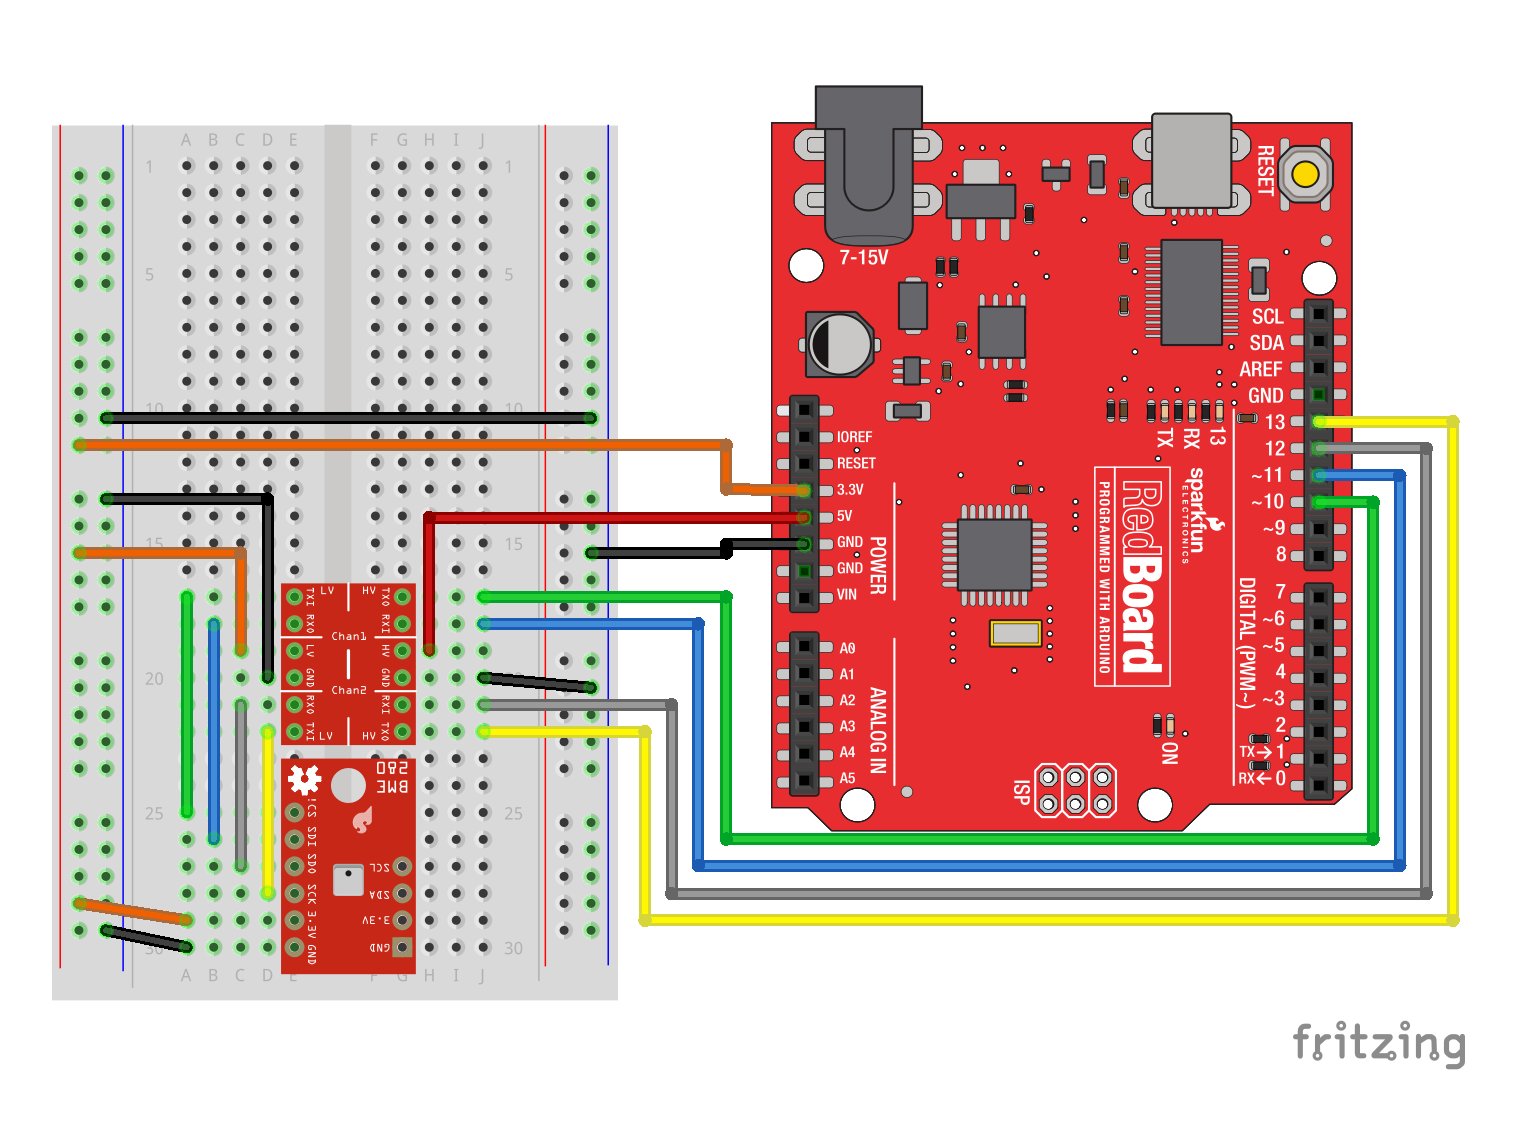
The SPI connection isn't quite straightforward when connected to a RedBoard. The Logic Level Converter is required to bridge between the 3.3v requirement of the BME280 and the 5v IO of the RedBoard. 3.3v microcontrollers such as the fabulous Teensy 3.2 can be directly connected.
We've created an Arduino library to get the BME280 operational with arduino IDE compatible boards. Before we get in to what the library does, obtain a copy of it.
Visit the GitHub repository to download the most recent version of the library, or click the link below:
For help installing the library, check out our How To Install An Arduino Library tutorial.
If you don't end up using the manger, you'll need to move the SparkFun_BME280_Arduino_Library folder into a libraries folder within your Arduino sketchbook.
Let's get started by looking at the functions that set up the BME280 Atmospheric Sensor:
In the global scope, construct your sensor object (such as mySensor or pressureSensorA) without arguments.
BME280 mySensor;
Rather that passing a bunch of data to the constructor, configuration is accomplished by setting the values of the BME280 type in the setup() function. They are exposed by being public: so use the myName.aVariable = someValue; syntax.
Settable variables of the class BME280:
language:c
//Main Interface and mode settings
uint8_t commInterface;
uint8_t I2CAddress;
uint8_t chipSelectPin;

uint8_t runMode;
uint8_t tStandby;
uint8_t filter;
uint8_t tempOverSample;
uint8_t pressOverSample;
uint8_t humidOverSample;
.begin();
Initialize the operation of the BME280 module with the following steps:
Returns the BME280 chip ID stored in the ID register.
.beginSPI(uint8_t csPin);
Begins communication with the BME280 over an SPI connection.
csPin: Digital pin used for the CS.
Output: BooleanTrue: Connected to sensor.
False: Unable to establish connection.
.beginI2C(TwoWire &wirePort); or .beginI2C(SoftwareWire &wirePort);
Begins communication with the BME280 over an I2C connection. If #ifdef SoftwareWire_h is defined, then a software I2C connection is used.
&wirePort: Port for the I2C connection.
Output: BooleanTrue: Connected to sensor.
False: Unable to establish connection.
.setMode(uint8_t mode);
Sets the operational mode of the sensor. (For more details, see section 3.3 of the datasheet.)
0: Sleep Mode
1: Forced Mode
3: Normal Mode
.getMode();
Returns the operational mode of the sensor.
0: Sleep Mode
1: Forced Mode
3: Normal Mode
.setStandbyTime(uint8_t timeSetting);
Sets the standby time of the cycle time. (For more details, see section 3.3 and Table 27 of the datasheet.)
0: 0.5ms
1: 62.5ms
2: 125ms
3: 250ms
4: 500ms
5: 1000ms
6: 10ms
7: 20ms
.setFilter(uint8_t filterSetting)
Sets the time constant of the IIR filter, which slows down the response time of the sensor inputs based on the number of samples required. (For more details, see section 3.4.4, Table 6, and Figure 7 of the datasheet.)
0: filter off
1: coefficient of 2
2: coefficient of 4
3: coefficient of 8
4: coefficient of 16
.setTempOverSample(uint8_t overSampleAmount);
Sets the oversampling option (osrs_t) for the temperature measurements. (Directly influences the noise and resolution of the data.)
0: turns off temperature sensing
1: oversampling ×1
2: oversampling ×2
4: oversampling ×4
8: oversampling ×8
16: oversampling ×16
Other: Bad Entry, sets to oversampling ×1 by default.
.setPressureOverSample(uint8_t overSampleAmount);
Sets the oversampling option (osrs_p) for the pressure measurements. (Directly influences the noise and resolution of the data.)
0: turns off pressure sensing
1: oversampling ×1
2: oversampling ×2
4: oversampling ×4
8: oversampling ×8
16: oversampling ×16
Other: Bad Entry, sets to oversampling ×1 by default.
.setHumidityOverSample(uint8_t overSampleAmount);
Sets the oversampling option (osrs_h) for the humidity measurements. (Directly influences the noise of the data.)
0: turns off humidity sensing
1: oversampling ×1
2: oversampling ×2
4: oversampling ×4
8: oversampling ×8
16: oversampling ×16
Other: Bad Entry, sets to oversampling ×1 by default.
.setI2CAddress(uint8_t address);
Changes the I2C address stored in the library to access the sensor.
address: The new I2C address.
.isMeasuring();
Checks the measuring bit of the status register for if the device is taking measurement.
True: A conversion is running.
False: The results have been transferred to the data registers.
.reset();
Soft resets the sensor. (If called, the begin function must be called before using the sensor again.)
.readFloatPressure();
Reads raw pressure data stored in register and applies output compensation (For more details on the data compensation, see section 4.2 of the datasheet.)
Returns pressure in Pa.
.readFloatHumidity();
Reads raw humidity data stored in register and applies output compensation (For more details on the data compensation, see section 4.2 of the datasheet.)
Returns humidity in %RH.
.readTempC();
Reads raw temperature data stored in register and applies output compensation (For more details on the data compensation, see section 4.2 of the datasheet.)
Returns temperature in Celsius.
.readTempF();
Reads raw temperature data stored in register and applies output compensation (For more details on the data compensation, see section 4.2 of the datasheet.)
Returns temperature in Fahrenheit.
The examples are selectable from the drop-down menu in the Arduino IDE, or they will run stand-alone if you put the contents of the libraries /src dirctory in with the example.ino file.
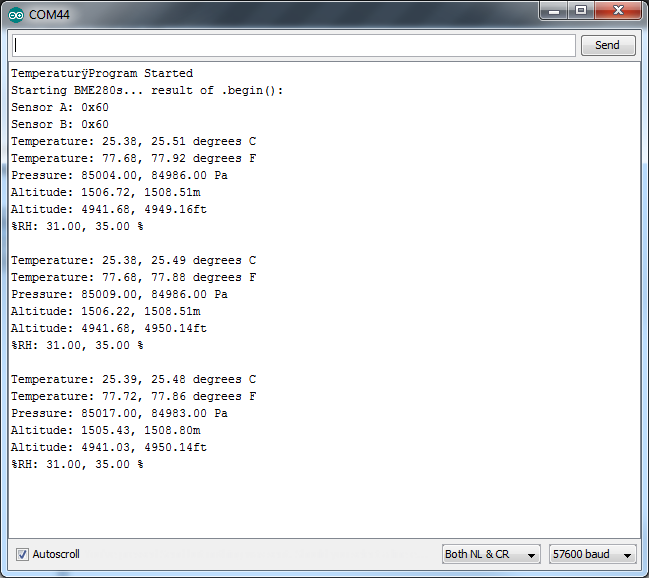
This example configures one BME280 on the SPI bus and another on the I2C bus. Then it gets the data and outputs from both sensors every second. If you only have 1 sensor connected the other channel reports garbage, so this can be a good troubleshooting and starting place.
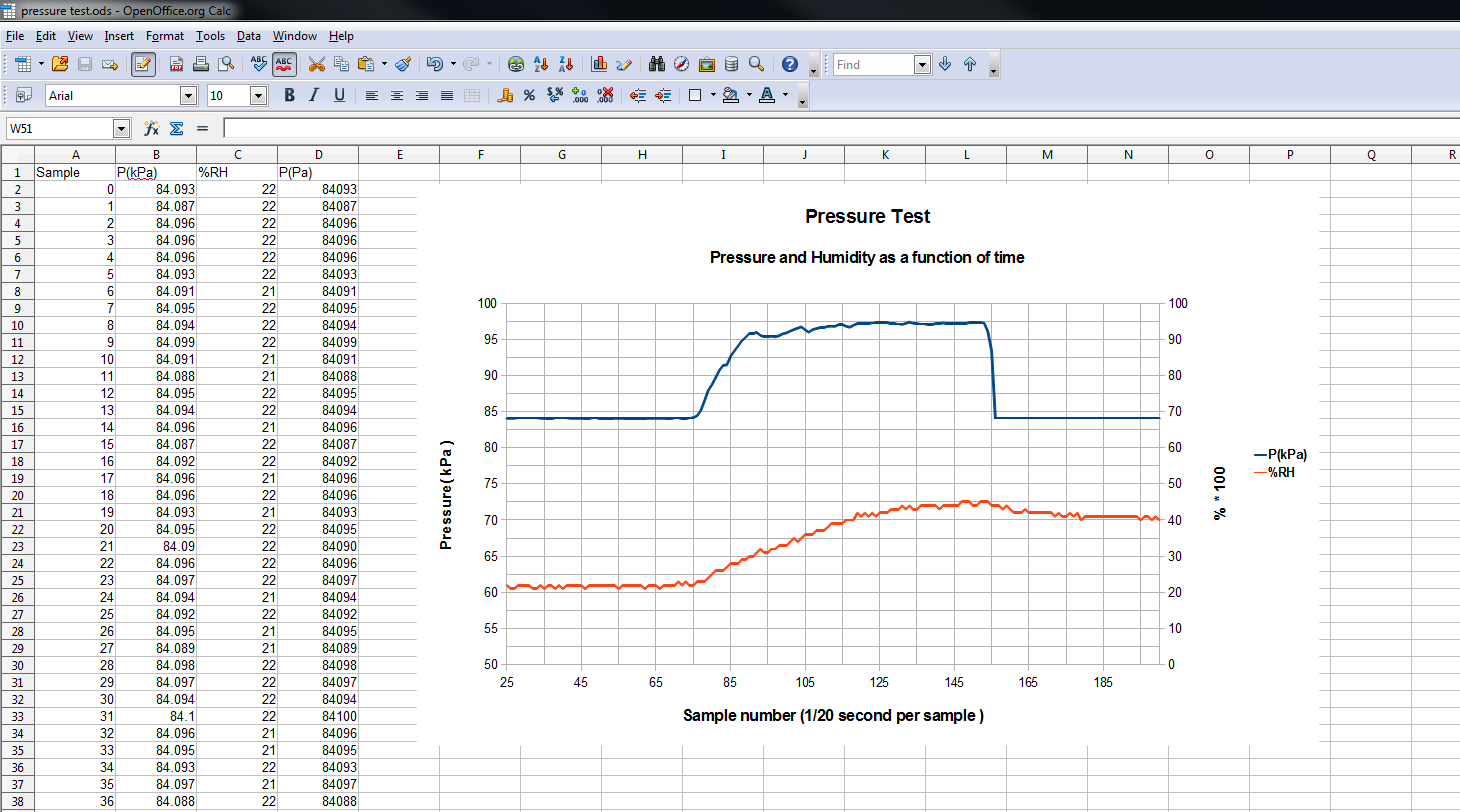
If you want to use the BME280 to record data as a function of time, this example is for you! It outputs text as CSV (comma separated vales) that can be copy-pasted into a textfile or spreadsheet app for graphing.
A note on accuracy: This sketch use "delay(50);" to wait 50ms between reads. The units of the 'sample' column are in (50ms + time-to-read) periods.

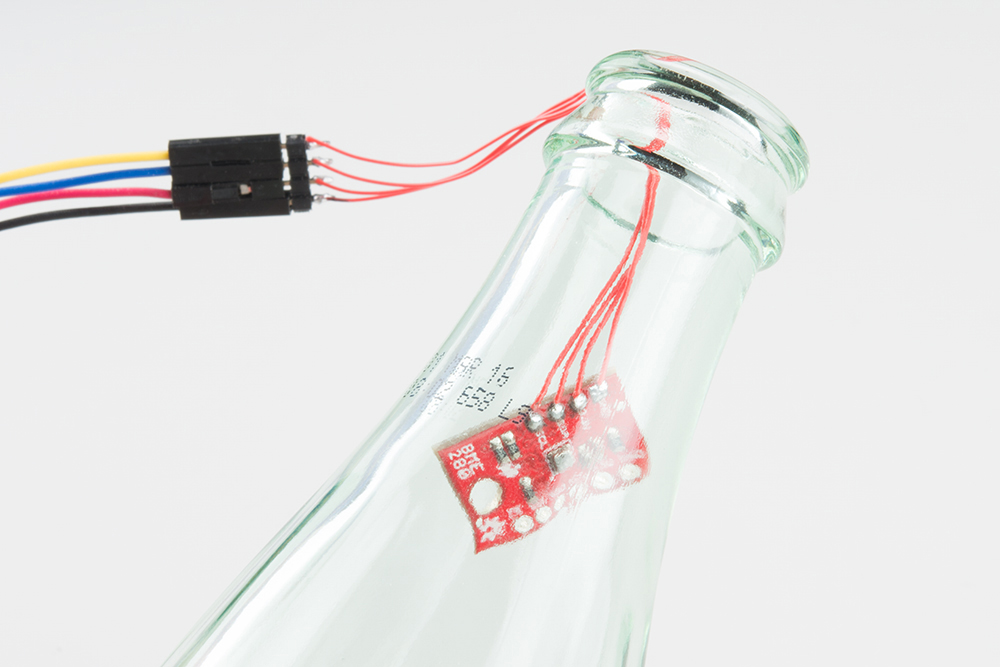
In order to demonstrate the operation, the BME280 is connected with fine hookup wires that are then placed in a bottle and pressurized with breath.
Data is collected from the event, and then a graph is made. To do this, the un-needed columns were deleted, and the pressure was scaled to kPa.
Here's an example that prints out the registers as well as the internally concatenated calibration words. It can be used to check the state of the BME280 after a particular configuration or can be implanted in your own sketch where you need to debug.

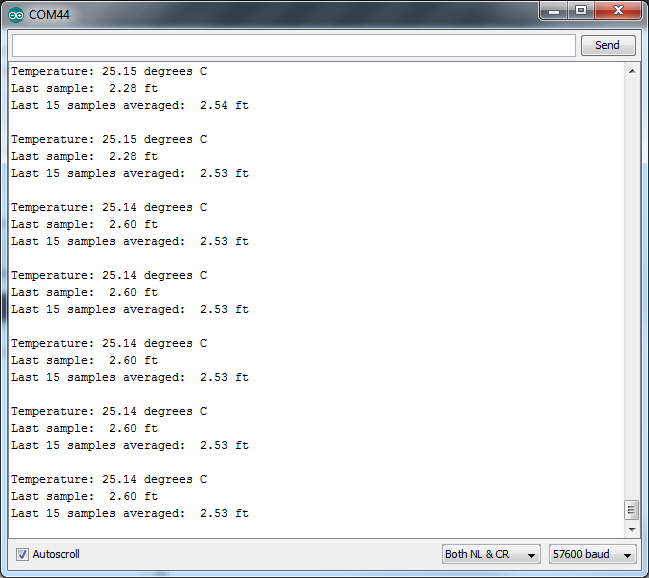
This example allows you to take measurements of change in altitude. It configures the BME280 with a lot of oversampling and also uses a software filter giving accurate but slow performance.
The sketch uses an additional button to zero the altitude. Push and hold until the average reaches zero.
The library also has a subfolder titled "More_Advanced" in the examples folder that contains the sketches used in the product video. They're modifications of the basic examples with a LCD added on. They are not covered by this tutorial.
Hopefully this guide has gotten your BME280 operational. What will it become? Weather monitoring? Flight control on a quadcopter? Terrarium climate control?
To get you thinking, here are a few articles to browse.
Let us know what your BME280 becomes!
Check out these other great weather related tutorials.
learn.sparkfun.com | CC BY-SA 3.0 | SparkFun Electronics | Niwot, Colorado