Single Board Computer Benchmarks
 Shawn Hymel
Introduction
A benchmark is a test used to judge the quality of similar things in a group, at least according to Merriam-Webster.

Many computer enthusiasts use a wide array of benchmarking tools to push their computers to the limits and compare the results. PC gaming fans, in particular, favor 3D graphics benchmarks, such as 3DMark to test their computer's gaming prowess. A single board computer (SBC) may not have the same computing power as a modern gaming desktop, but it can still be quite useful and powerful in the right situation.
SBC users have myriad uses for their tiny computers, so subjecting them to just one benchmark, such as graphics, would be remiss of us to not take power, CPU, RAM, etc. into account. As a result, we put together a suite of tests that cover a breadth of characteristics of the various SBCs.
Note that benchmarking tools generally do not accurately represent how a user might interact with the computer and instead test only one or two aspects of the computer. Additionally, several factors might influence how the benchmark performs, such as specific versions of libraries (e.g. X11 libraries), compiler options used, and even the version of benchmarking tool used.
We want to test the out-of-box performance of several SBCs, and as such, we try to keep all software as default as possible (vanilla install from the manufacturer's site or pre-installed on the SBC). We will also try to list which versions of the operating system (OS) and benchmarking tool we used so you can have an idea of where things might differ.
The intent of these tests is to give you an idea of the relative performance among several SBCs. As a result, we don't have to be very accurate, but we would like to try and be as precise as possible so we can compare relative performance. These tests are more broad than in-depth. Additionally, we can choose to leave out tests that require a graphical user interface (GUI) for modules like the Edison.
In the Tests section, we will cover the various benchmarking tools used, what they test, and how to install them (should you wish to replicate our results).
Every so often, we will benchmark a set of SBCs. Each "round" will ideally cover a subset of SBC within a generation (e.g. "Round 1" might have the Raspberry Pi 2 where as "Round 2" might have the Raspberry Pi 3).
Recommended Reading
Before delving into the benchmarks, we recommend you become familiar with Linux and some of the command line tools. Additionally, we will be looking at power consumption, so a refresher on electric power might be useful.
The Tests
For the majority of the benchmarks, we rely on a few tests within the Phoronix Test Suite (PTS), which is a free, open-source benchmarking tool for Linux (other operating systems are supported). The slick part about PTS is that it can automatically upload results to Open Benchmarking, which we will use liberally. Open Benchmarking is an online platform where users can store their results from PTS, publicly or privately. The power test is not part of PTS, so we will perform it separately.
Phoronix Test Suite
PTS will handle most of our tests. We first need to make sure the PHP 5 command interpreter is installed. On Debian systems, use:
sudo apt-get update
sudo apt-get install php5-cli
We can then download and install v5.8.1 of PTS:
git clone https://github.com/phoronix-test-suite/phoronix-test-suite/
cd phoronix-test-suite
git checkout v5.8.1
./install-sh
./install-sh NEW_DIR.To run any of the tests, install it first using the install command with the name of the test followed by calling benchmark and the test name.
phoronix-test-suite install pts/<TEST>
phoronix-test-suite benchmark pts/<TEST>
The test can be selected from any of the profiles listed on the Open Benchmarking Test Profiles page. We will be using only a few of these tests.
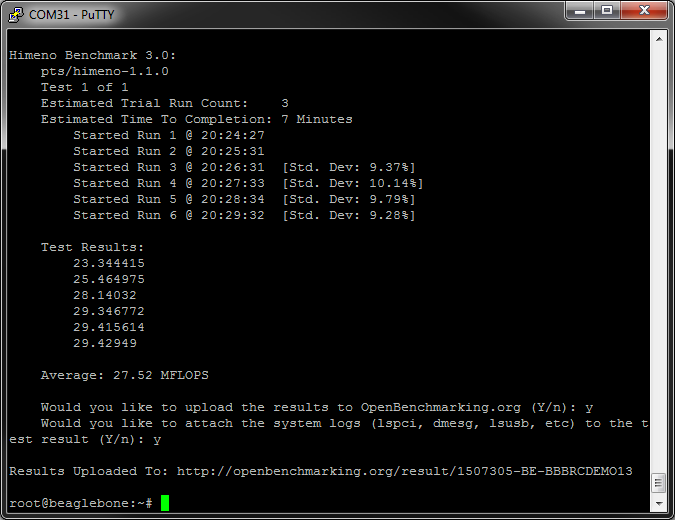
sudo service lightdm stop.For example, we can run the Himeno test on a BeagleBone Black Rev C (BBBrC). Once it completes, it will provide a text output of the results, which we can choose to upload to openbenchmarking.org. A link will appear in the console showing you where to find your results (http://openbenchmarking.org/result/1507305-BE-BBBRCDEMO13 in the example below).
CPU (Single Core)
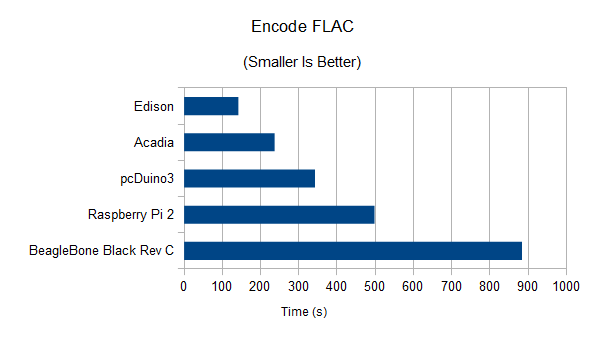
The backbone of any computer is the ability to execute instructions and perform arithmetic. We will test simple number crunching abilities with the encode-flac test. This simple test times how long it takes the CPU to encode a sample WAV file into a FLAC format.
At this time, the default FLAC encoder only uses one thread, which means we are able to compare single core speeds.
Run the encode-flac test with:
phoronix-test-suite install pts/encode-flac
phoronix-test-suite benchmark pts/encode-flac
phoronix-test-suite benchmark 1507085-BE-SFEEDISON70
CPU (Multi-core)
While testing a single core is great for measuring raw speed, many newer computers (including SBCs) are created with multi-core processors. Having multiple cores allows a computer to run threads simultaneously. If a program is written to be multi-threaded, it can take advantage of more than one core and significantly speed up execution time.
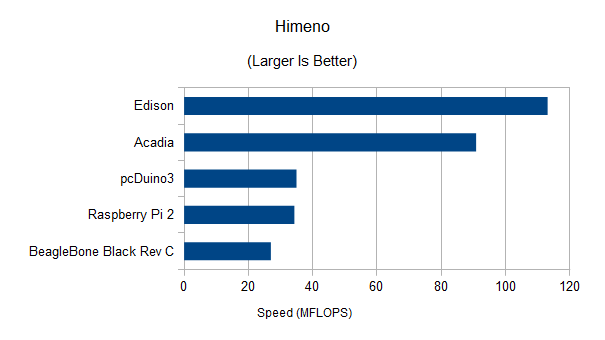
We can measure multi-core performance using the Himeno benchmark. According to Open Benchmarking:
The Himeno benchmark is a linear solver of pressure Poisson using a point-Jacobi method.
If you are masochistically curious what the pressure Poisson equation is, see this.
Run the Himeno benchmark with:
phoronix-test-suite install pts/himeno
phoronix-test-suite benchmark pts/himeno
RAM
Another important feature of a computer is how fast it can read and write to random-access memory (RAM). RAM is great for storing short-term or volatile data. How fast we access that is another useful indicator of system performance.
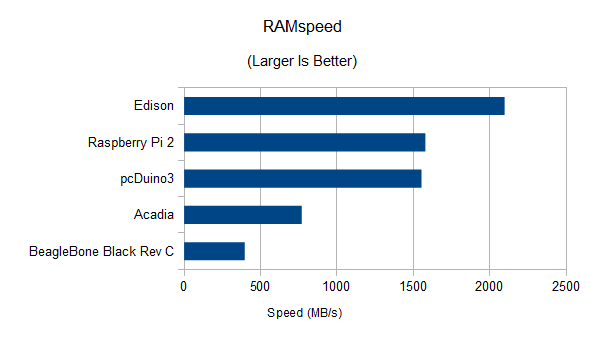
For RAM, we will use the RAMspeed benchmark. This test is capable of running with a variety of parameters, but we will use the simplest one: copying a bunch of integers to and from RAM. This should hopefully give us an idea of the combined read and write speed.
phoronix-test-suite install pts/ramspeed
phoronix-test-suite benchmark pts/ramspeed
Flash Memory
RAM is great for storing data that requires shorter access times, but hard disk drives (HDDs) allow for non-volatile storage (i.e. we don't lose the data when power is removed). Most SBCs do not use a true "hard disk" but rely on SD cards or onboard eMMC for non-volatile storage, which we will refer to as "flash memory."
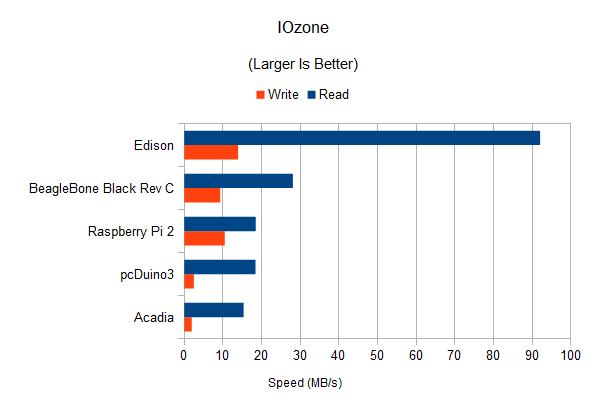
Like RAM, we can test the performance of the file system and flash memory. The IOzone test reads or writes large amounts of data to the non-volatile memory. We will test both read and write as separate tests using 1 MB blocks and a 2 GB test file (we want the test file to be larger than RAM so our operating system does not cache it in RAM).
phoronix-test-suite install pts/iozone
phoronix-test-suite benchmark pts/iozone
Graphics (2D)
As SBCs become more powerful, they are seeing use as home theater PCs and even low-end gaming machines. Many SBCs come with a version of OpenGL or OpenGL ES to handle graphics.
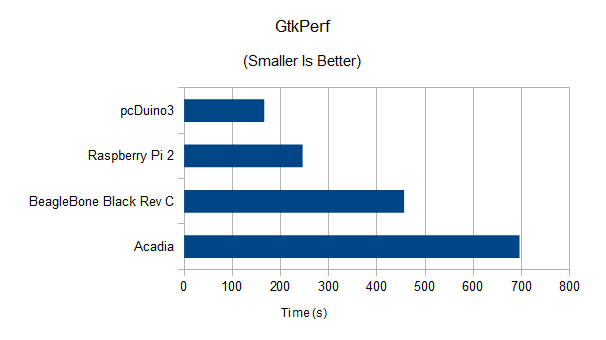
While we were unable to find a good 3D benchmark that ran well on the SBCs, we can test the computer's ability to draw simple 2D shapes. We used GtkPerf found within PTS to accomplish this. Specifically, we use the circles drawing test, which times how long it takes to draw a set number (in the thousands) of filled circles in a window. This fairly quick test allows us to compare the relative 2D graphics speed of SBCs.
phoronix-test-suite install pts/gtkperf
phoronix-test-suite benchmark pts/gtkperf
Power Test
Another important factor for SBCs is power consumption. Many users want to leave their SBC running continuously and want to know how much current the SBC will draw. How does it compare, for example, to leaving a light bulb on?
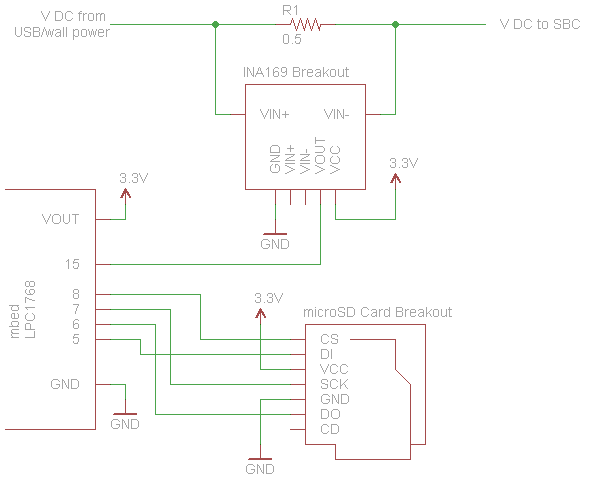
To test power consumption, we created a current logging device, lovingly named the "Current Log-O-Matic," using an mbed LPC1768, an INA169 Breakout, and a microSD Card breakout.
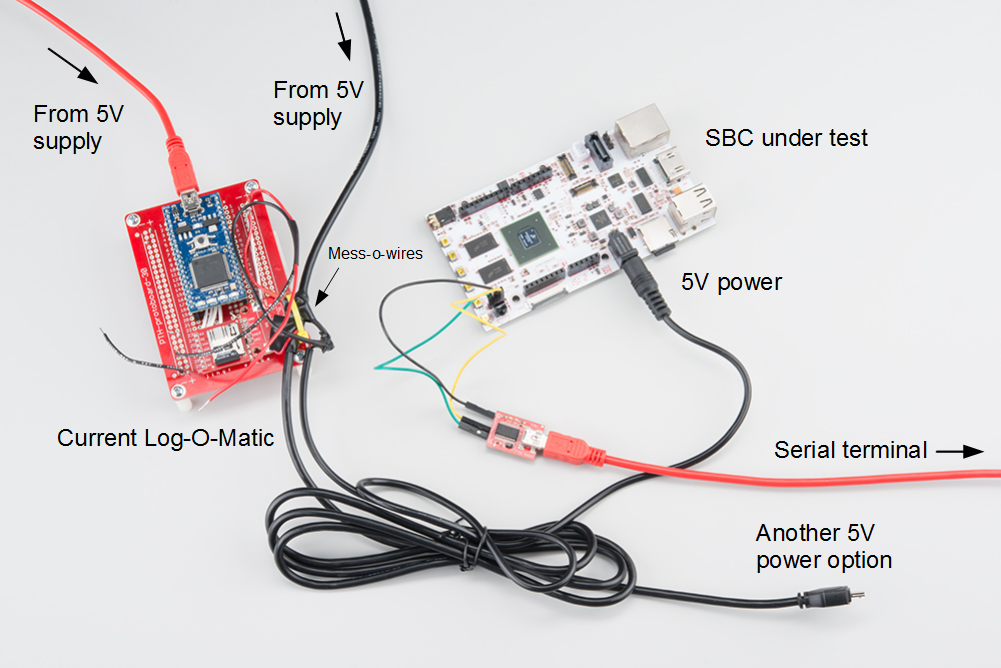
The schematic for the Current Log-O-Matic can be found below and the code can be found on mbed's site.
The Current Log-O-Matic, on boot, records 10 seconds of measured current use (flowing through the INA169 breakout's sense resistor) in about 20 ms increments. This information is put into a spreadsheet and the average current over those 10 seconds is computed.
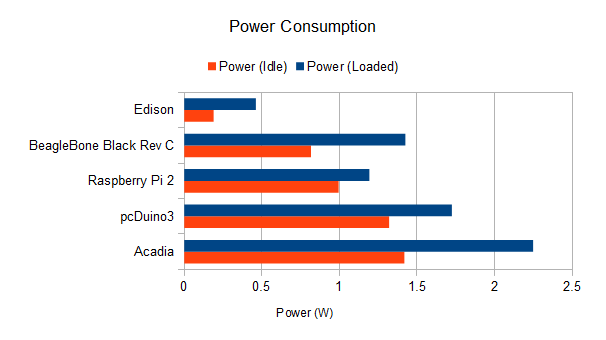
We wanted to compute the idle and loaded power consumption. To do that, we booted the SBC under test and logged in to the console using a serial terminal. We disabled any extraneous features such as the GUI (e.g. X Windows), WiFi, and Bluetooth. While idle (doing nothing in the console), we took a voltage measurement at the input of the SBC (we want to test the power usage of the whole board) and ran the Current Log-O-Matic. We computed the average idle power usage with P = V x I using the measured voltage (with the assumption that the voltage did not vary much) and average current.
We repeated the test while the SBC was running the Himeno multi-core CPU test to measure the average current usage under load. The average power consumption was also computed using P = V x I.
Round 1
The Contenders
Raspberry Pi 2 (Model B)
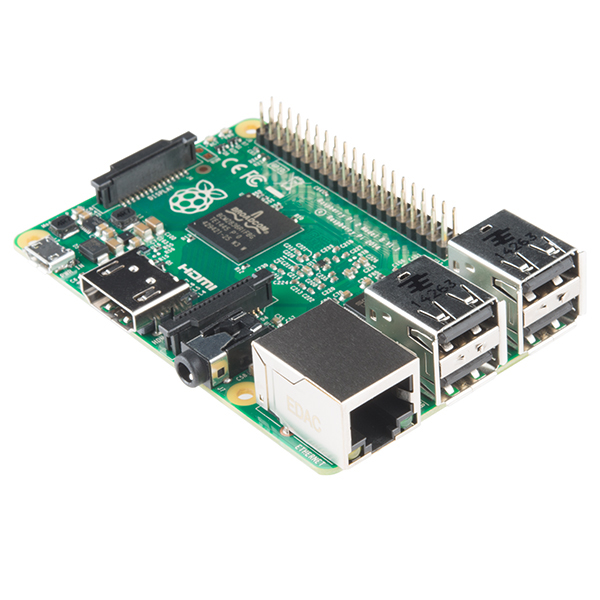
The Raspberry Pi was created as a cheap platform to teach the basics of computer science to students. It is one of the cheapest and most popular SBCs available. We tested a Raspberry Pi 2 - Model B against other SBCs in this round. Running uname -a gives us the version of Linux:
Linux raspberrypi 3.18.11-v7+ #781 SMP PREEMPT Tue Apr 21 18:07:59 BST 2015 armv7l GNU/Linux
BeagleBone Black - Rev C
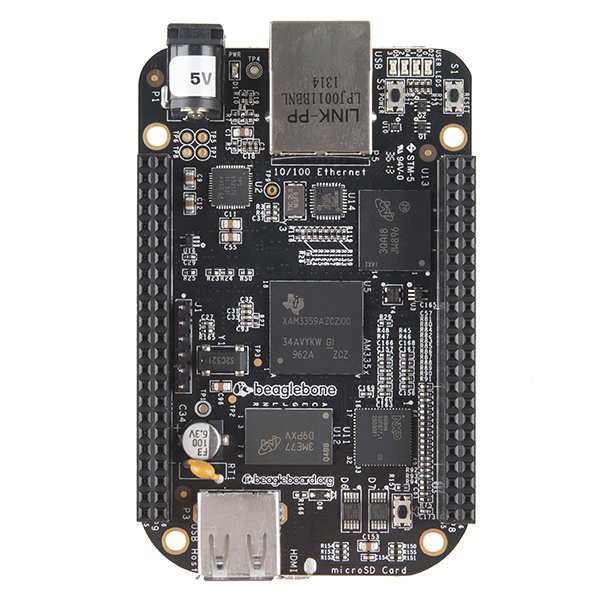
The BeagleBone Black was created by Texas Instruments as an open source single board computer for the masses. Revision C increased the onboard storage to 4 GB and comes pre-loaded with a Debian Linux image. The version of Linux used in the tests was:
Linux beaglebone 3.8.13-bone47 #1 SMP Fri Apr 11 01:36:09 UTC 2014 armv7l GNU/Linux
Intel® Edison
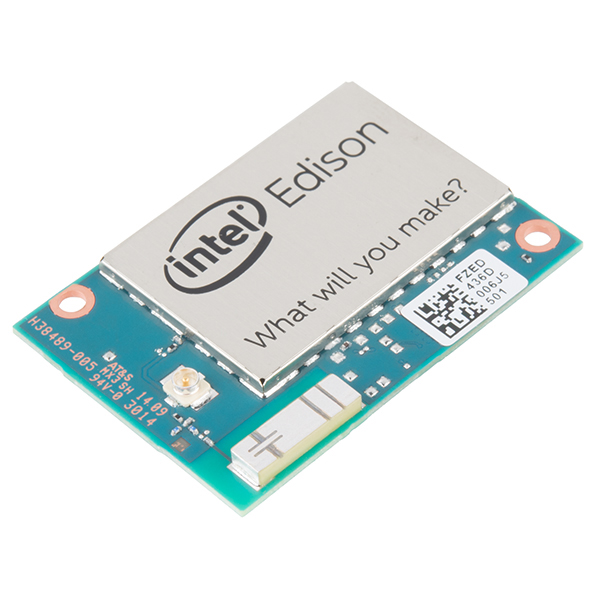
The Intel® Edison is a tiny computer module intended for wearable devices. Without a video out port, it may not meet the definition of "single board computer." However, because it is capable of running Linux, we can compare its performance against other SBCs, with the exception of the graphics tests. The version we tested was running:
Linux edison 3.10.17-poky-edison+ #1 SMP PREEMPT Wed Apr 29 03:54:01 CEST 2015 i686 GNU/Linux
pcDuino3
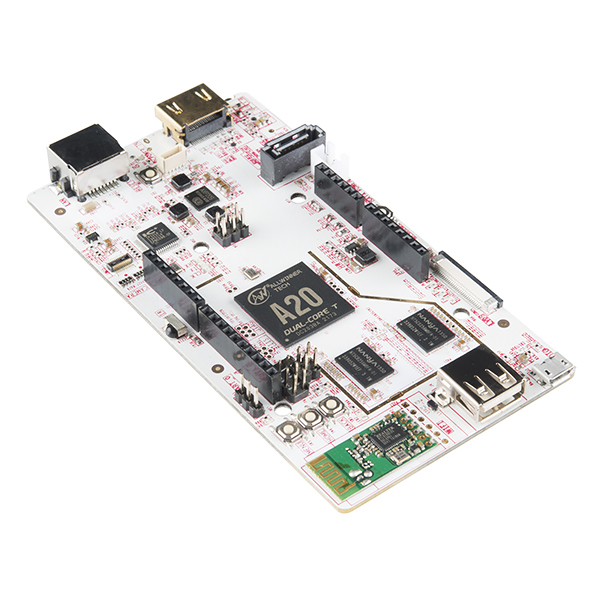
The pcDuino is LinkSprite's version of a Raspberry Pi and Arduino mashup. The pcDuino is capable of running Linux and emulating an Arduino at the same time. Note that we ran the OS from a microSD card and not a disk drive connected to the SATA port. We tested version 3, which was running:
Linux ubuntu 3.4.79+ #12 SMP PREEMPT Mon Jul 21 13:05:42 CST 2014 armv7l armv7l armv7l GNU/Linux
Acadia
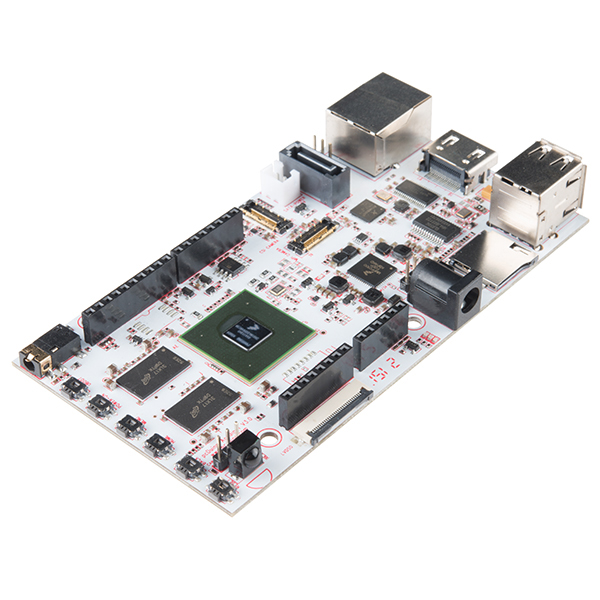
LinkSprite created the Acadia to bring higher-performing ARM CPUs to the SBC market. The Acadia is built around the powerful Freescale i.MX6 processor. Note that we ran the OS from a microSD card and not a disk drive connected to the SATA port. The Linux version was:
Linux Acadia 3.0.35-2666-gbdde708 #76 SMP PREEMPT Tue Feb 10 23:03:49 PST 2015 armv7l armv7l armv7l GNU/Linux
Specifications
For a quick comparison, we have provided some tables showing the various features of the SBCs under test.
| Device | Processor | Architecture | CPU Speed | Cores | GPU |
|---|---|---|---|---|---|
| Raspberry Pi 2 | Broadcom BCM2836 | ARM Cortex-A7 | 900 MHz | 4 | Broadcom |
| BeagleBone Black Rev C | TI Sitara AM335x | ARM Cortex-A8 | 1 GHz | 1 | PowerVR SGX530 |
| Intel Edison | Intel Atom Z34XX | Silvermont x86 | 500 MHz | 2 | None |
| pcDuino3 | Allwinner A20 | ARM Cortex-A7 | 1 GHz | 2 | Mali-400MP2 |
| Acadia | Freescale i.MX6 | ARM Cortex-A9 | 1.2 GHz | 4 | Vivante GC2000 |
| Device | RAM Size | RAM Type | Onboard Storage | Flash Slot |
|---|---|---|---|---|
| Raspberry Pi 2 | 1 GB | LPDDR2 | None | microSD |
| BeagleBone Black Rev C | 512 MB | DDR3 | 4 GB | microSD |
| Intel Edison | 1 GB | LPDDR3 | 4 GB | None |
| pcDuino3 | 1 GB | DDR3 | 4 GB | microSD |
| Acadia | 1 GB | DDR3 | None | microSD |
| Device | USB | SATA | Audio Out | HDMI | Ethernet | WiFi | Bluetooth | GPIO | Price |
|---|---|---|---|---|---|---|---|---|---|
| Raspberry Pi 2 | Yes | No | Yes | Yes | Yes | No | No | 17 | $39.95 |
| BeagleBone Black Rev C | Yes | No | No | Yes | Yes | No | No | 66 | $54.95 |
| Intel Edison | Yes | No | No | No | No | Yes | Yes | 40 | $49.95 |
| pcDuino3 | Yes | Yes | Yes | Yes | Yes | Yes | No | 22 | $59.95 |
| Acadia | Yes | Yes | Yes | Yes | Yes | No | No | 22 | $119.95 |
The Results
And now for the part you have been waiting for: the results! We will present a comparison chart for each test. You will also be able to find a link to the raw test results in each section should you desire more details.
CPU (Single Core)
Times how long it takes to convert a .WAV audio file to a FLAC file. The raw test results can be found here.
CPU (Multi-Core)
Computes floating point operations per second (in MFLOPS) by timing how long it takes to solve a pressure Poisson equation. The raw test results can be found here.
RAM
Tests aggregate RAM read and write speed. The raw test results can be found here.
Flash Memory
Transfers files to and from flash memory to compute the read and write rates. The raw test results can be found here and here.
Note that the BeagleBone Black Rev C test was slightly different, as we had to use a 512 MB test file (instead of the 2 GB file used for the other tests). There was simply not enough space on the BeagleBone Black's onboard eMMC.
Graphics (2D)
Times how long it takes to draw a set number of filled circles (many thousands) in a window. The raw test results can be found here.
Note that we left out the Edison as it does not have a video out port and therefore no default GUI.
Power
Compute average power consumption based on measured current draw (averaged over 10 seconds) and measured DC voltage. The raw test results can be found here.
Conclusion
Which SBC is the "best" really depends on what you want to do with it. RAM speed might be important in some applications whereas graphics capabilities might be more important in others. When looking at purchasing a single board computer, do not neglect the importance of physical board size and community support, which were not covered in these tests.
If you have questions or comments on the tests (or just want to talk about single board computers!), please leave them in the Comments Section.